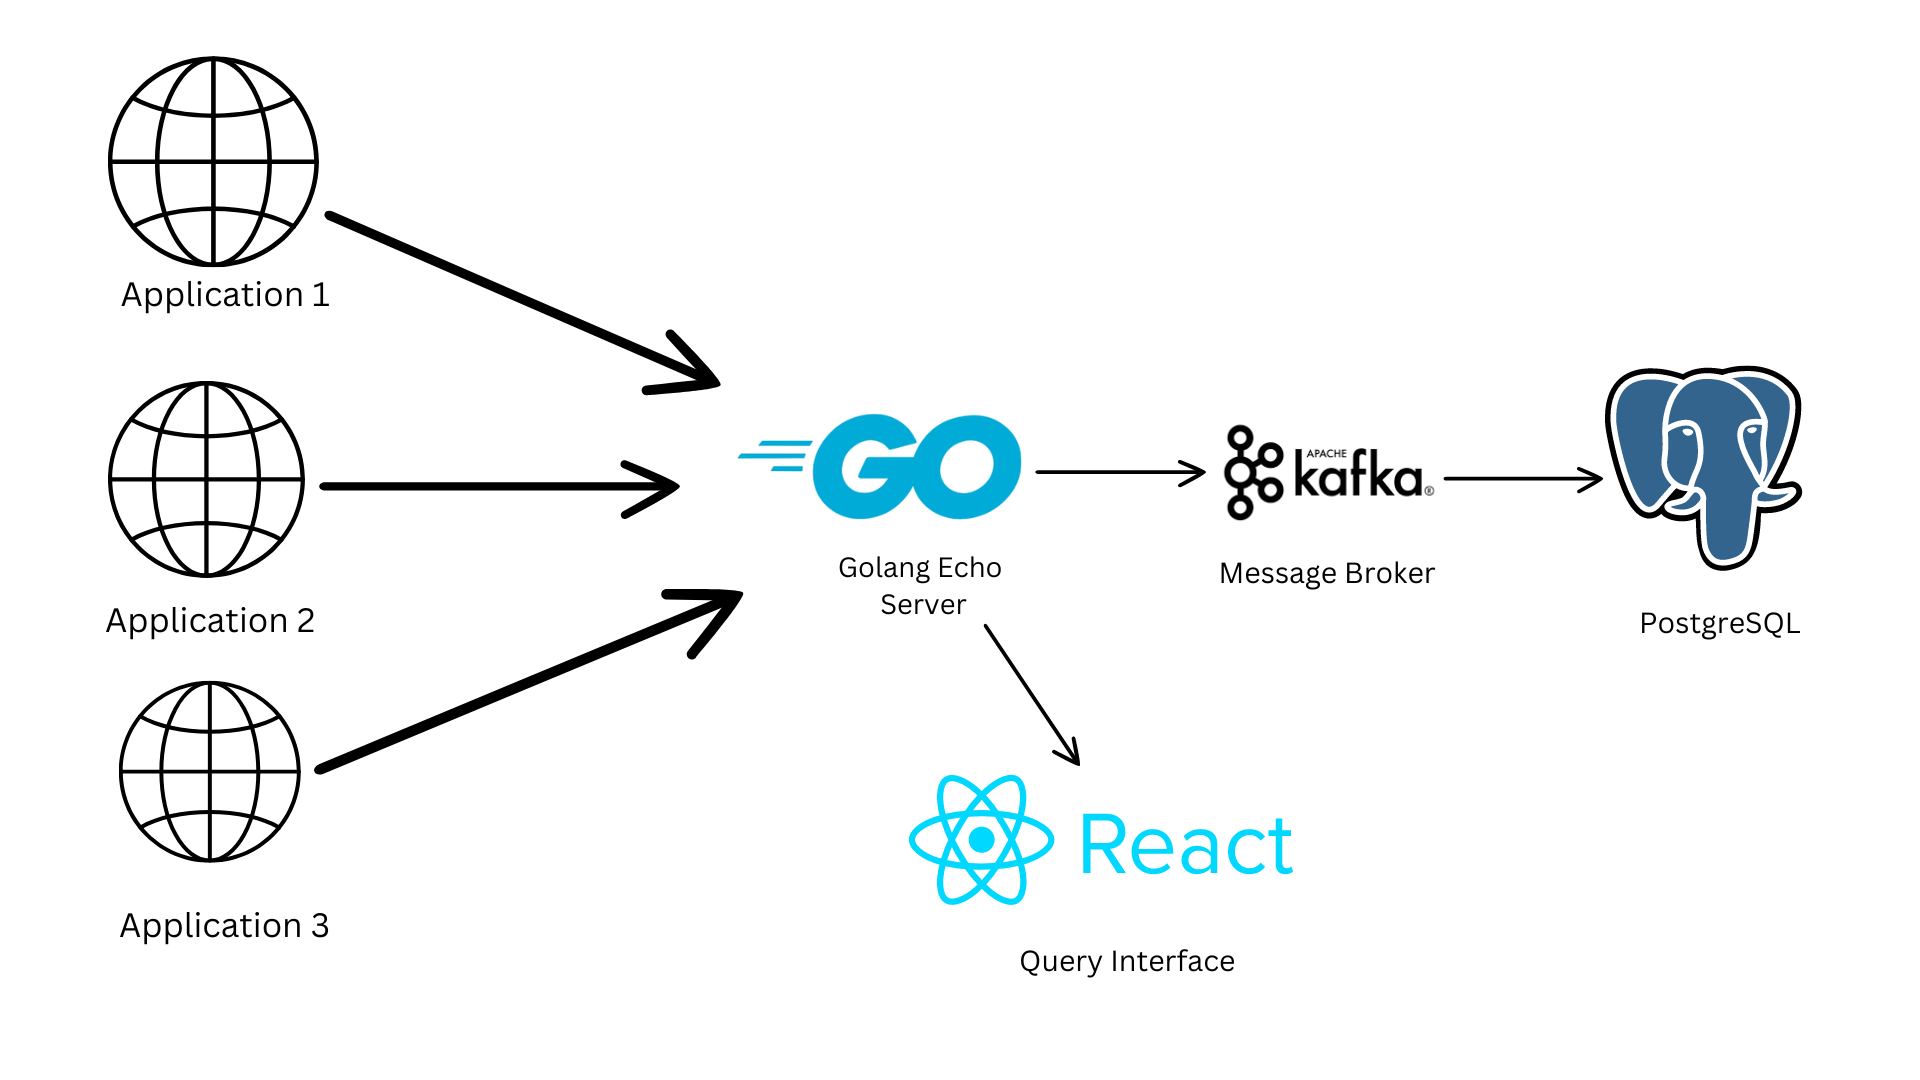
Log Ingestor provides a highly scalable log management solution optimized for ingesting and analyzing large volumes of log data in real-time. The key features of Log Ingestor include high scalability and a user-friendly React based query interface.
It consists of two main components.
- Log Ingestor : A golang application based on echo web framework that ingests data and queues it Apache Kafka and saves it in PostgreSQL database.
- Query Interface : A React based frontend to visualize and filter logs based on several combination of parameters.
- Backend : Golang Echo Framework
- Frontend : ReactJs
- Database : PostgreSQL
- Message Broker : Apache Kafka
- Monitoring Tool : Prometheus, Grafana
Application : There are multiple applications each generating log data. These applications represent the sources of the log messages that need to be stored.
Golang Server : These applications send their log data to a central Golang server, which operates using the Echo framework. The Golang server acts as the initial collection point for logs, handling incoming requests efficiently.
Apache Kafka : The log data is then forwarded from the Golang server to Apache Kafka. Kafka serves as a robust message broker, which queues the incoming log data. It is responsible for managing the log messages, ensuring they are processed and stored reliably.
Batch Processing : Apache Kafka aggregates the log messages and pushes them to the database in batches of maximum 2000. This batch processing helps in managing the data flow and reduces the overhead on the database.
PostgreSQL Database : The accumulated log messages are stored in a PostgreSQL database. PostgreSQL is a powerful, open-source object-relational database system that provides strong data integrity and supports complex queries.
ReactJS Frontend : For log visualization and search, the system features a frontend user interface constructed with ReactJS. This UI is engineered to deliver a seamless experience when searching for and analyzing log data, leveraging Material-UI for table visualizations and data filtering. Additionally, it utilizes server-side pagination, enhancing the real-time log search capabilities by efficiently fetching data in manageable segments from the PostgreSQL database in response to user queries.
docker-compose upAll the servies will be up and running on the following ports :
Kafka : localhost:9092
Postgress : localhost:5432
Log-ingestor-application : localhost:3000
React Application : localhost:4000
Prometheus Server : localhost:9090
Grafana Dashboard : localhost:5000Make a post request to this endpoint for log-ingestion.
http://localhost:3000/public/ingest-kafkaJSON Schema of a log request :
{
    "level": "error",
    "message": "Failed to connect to DB",
    "resourceId": "server-1234",
    "timestamp": "2023-09-15T08:00:00Z",
    "traceId": "abc-xyz-123",
    "spanId": "span-456",
    "commit": "5e5342f",
    "metadata": {
        "parentResourceId": "server-0987"
    }
}You can start load test or a spike test by installing k6. Go to this link to download and install k6.
Run this command to start spike-test :
k6 run tools/k6/spike_test.js
or
make spike-test