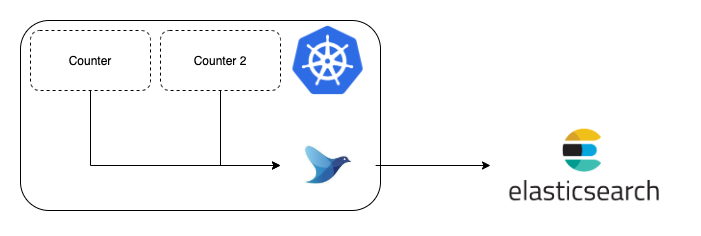
We would like to display the logs generated by the load tests during the continuous testing phase of the pipeline in the production environment. To generate the logs and display it, we have decided to use fluentd, kibana and elasticsearch.
As the out of the box log collection feature of Kubernetes is not very flexible, we decided to use Kubernetes Logging Agent (using elasticsearch and kibana).
The steps mentioned below demonstrates how Fluentd collects logs from the Kubernetes server itself, pushes them to an Elasticsearch cluster that can be viewed on Kibana.
Elasticsearch : Elasticsearch is a search engine based on the Lucene library. It provides a distributed, multitenant-capable full-text search engine with an HTTP web interface and schema-free JSON documents.
Kibana: Kibana is a free and open user interface that lets you visualize your Elasticsearch data and navigate the Elastic Stack.
Fluentd: Fluentd is an open source data collector for unified logging layer. Fluentd is flexible enough and has proper plugins to distribute logs to different third party applications like databases or cloud services.
Minikube: Minikube is a tool that lets you run Kubernetes locally. Minikube runs a single-node Kubernetes cluster on your personal computer (including Windows, macOS and Linux PCs) so that you can try out Kubernetes, or for daily development work.
Due to the consistency of Kubernetes, there are only a few high-level approaches to solve the problem of logging.
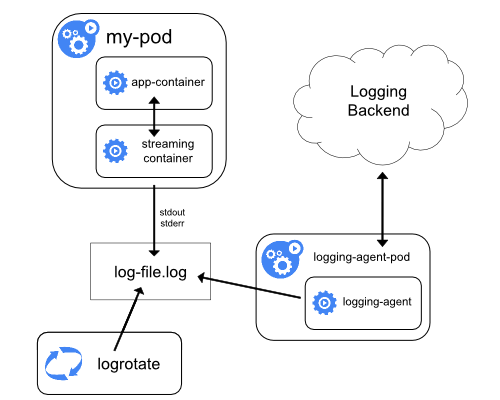
One common approach to lead logs is directly from the server, using an entirely external pod. This pod will aggregate logs for the entire server, ingesting and collecting everything once. This can be either implemented using static pod, or using "DaemonSet".
Kubernetes offers a basic bare solution (out of the box) to collect logs. Using Kubernetes's out of the box logging features, it is not possible to see the logs of a deleted pod or it becomes cumbersome with the most basic of complications as we need to keep adding switched. When combined with the volatility of the pod log storage, these approaches betray the lack of sophistication in this tooling.
Hence, to remedy these issues, Kubernetes Logging Agent are used.
Logging agents the middlemen of log collection. There is an application that is writing logs and a log collection stack, such as Elasticsearch that is analyzing and rendering those logs. Something needs to get the logs from A to B. This is the job of the logging agent.
The advantage of the logging agent is that it decouples this responsibility from the application itself. Instead of having to continuously write boilerplate code for your application, you simply attach a logging agent and watch the magic happen.
To use logging agents, we first setup Elasticsearch server and a Kibana server. This can either be hosted on a cloud provider or ran locally.
To run it locally, we created the following file:
version: '3'

services:
 elasticsearch:
   image: docker.elastic.co/elasticsearch/elasticsearch:7.6.2
   environment:
     - cluster.name=docker-cluster
     - discovery.type=single-node
     - bootstrap.memory_lock=true
     - "ES_JAVA_OPTS=-Xms512m -Xmx512m"
   ulimits:
     memlock:
       soft: -1
       hard: -1
   ports:
     - "9200:9200"
 kibana:
   image: docker.elastic.co/kibana/kibana:7.6.2
   ports:
     - "5601:5601"
We wrote this to a file named docker-compose.yaml and ran the following command from the same directory to bring up your new log collection servers:
docker-compose up
They will take some time to spin up, but once they’re in place, we can navigate to http://localhost:5061 and see the fresh Kibana server.
We used Minikube with this setup (which is likely if Elasticsearch is running locally), and we needed to know the bound host IP that minikube uses. To find this, we ran the following command:
minikube ssh "route -n | grep ^0.0.0.0 | awk '{ print \$2 }'"
This will print out an IP address. This is the IP address is of Elasticsearch server.
We built the docker image (using docker build command).
The "dockerfile" is present inside the “fluentd_log_collector” folder. We added a tag to it and pushed it to google container registry.
Steps to push the docker image to google container registry:
- Tag the image using the command:
docker tag 5e9293b7f74f gcr.io/grand-radio-307118/efk_trial:samp27
-
"5e9293b7f74f" is the image id that has been generated locally.
-
"efk_trial" is the name of the image.
-
"samp27" is the tag we are assigning to the image.
-
“grand-radio-307118” is the project name on google cloud.
-
Once the image is tagged, push the image to the google container registry using the following command:
docker push gcr.io/grand-radio-307118/efk_trial
To collect the logs in a production-ready Kubernetes environment, the first step is to use DaemonSet that will deploy one pod per node in our cluster. An example is given below:
apiVersion: apps/v1
kind: DaemonSet
metadata:
 name: fluentd
 namespace: kube-system
 labels:
   k8s-app: fluentd-logging
   version: v1
spec:
 selector:
   matchLabels:
     k8s-app: fluentd-logging
     version: v1
 template:
   metadata:
     labels:
       k8s-app: fluentd-logging # This label will help group your daemonset pods
       version: v1
   spec:
     tolerations:
     - key: node-role.kubernetes.io/master
       effect: NoSchedule # This will ensure fluentd collects master logs too
     containers:
     - name: fluentd
       image: fluent/fluentd-kubernetes-daemonset:v1-debian-elasticsearch
       env:
         - name:  FLUENT_ELASTICSEARCH_HOST
           value: "localhost" # Or the host of your elasticsearch server
         - name:  FLUENT_ELASTICSEARCH_PORT
           value: "9200" # The port that your elasticsearch API is exposed on
         - name: FLUENT_ELASTICSEARCH_SCHEME
           value: "http" # Either HTTP or HTTPS.
         - name: FLUENT_ELASTICSEARCH_USER
           value: "elastic" # The username you've set up for elasticsearch
         - name: FLUENT_ELASTICSEARCH_PASSWORD
           value: "changeme" # The password you've got. These are the defaults.
       resources:
         limits:
           memory: 200Mi
         requests:
           cpu: 100m
           memory: 200Mi
       volumeMounts:
       - name: varlog
         mountPath: /var/log
       - name: varlibdockercontainers
         mountPath: /var/lib/docker/containers
         readOnly: true
     terminationGracePeriodSeconds: 30
     volumes:
     - name: varlog
       hostPath:
         path: /var/log
     - name: varlibdockercontainers
       hostPath:
         path: /var/lib/docker/containers
We need to change the value of “FLUENT_ELASTICSEARCH_HOST” to the IP address of our machine.
We renamed the image name to the appropriate image name that we had tagged in the previous step while pushing the image to the google container registry.
We saved this to a file named load_test_prod.yaml and deployed it to your cluster using the following command:
kubectl apply -f load_test_prod.yamlThen, we can monitor the pod status with the following command:
kubectl get pods -n kube-systemEventually, we will see the pod become healthy and the entry in the list of pods will look like this:
fluentd-4d566 1/1 Running 0 2m22sAt this point, we’ve deployed a DaemonSet and we’ve pointed it at our Elasticsearch server.
Wait for a minute and run the following command to see if the fluentd daemonset is up and running.
kubectl get pods -n kube-systemWe can open the browser and navigate to http://localhost:5601.
A dashboard opens up and on the left-hand side, a menu can be seen. The discover icon is a compass and it’s the first one on the list. Clicking on that will take us to a page listing out your indices.
we can click on "Index Patterns" and create an index pattern.
We can see that Fluentd has followed a 'Logstash' format and we can create logstash-* to capture the logs coming out from out cluster.
Fluentd also shows the timestamp of the log and the logging shows the log in a compatible way.
We will go ahead and create the index pattern and see that fluentd has added lot of fields in the index.
We can see the logs of the load tests and use 'kubernetes.pod_name' to filter out the pods.
Example is shown below. :
Hence, we can see the logs generated by the load tests from the pods on Kibana with the help of Elasticsearch.

