- Object Page - Header Area
Search term: #HeaderInfo
The title and subtitle of an Object Page are defined with the annotation @UI.headerInfo.
Note
Source: Metadata Extension /DMO/FSA_C_RootTP
// Search Term #HeaderInfo
@UI.headerInfo: {
  typeName: 'Object Page - Root',
  typeNamePlural: 'Root Entities (#ListTableTitle)', // Search Term #ListTableTitle
  typeImageUrl: 'sap-icon://sales-order',
  imageUrl: 'ImageUrl',
  title: {
    value: 'StringProperty',
    type: #STANDARD
  },
  description: {
    label: 'Root entity',
    type: #STANDARD,
    value: 'StringProperty'
  }
}
The attribute typeName is the title and it is displayed next to the SAP Logo in header bar on the Object Page. The attribute typeNamePlural will be shown, if all entities are shown in a table. The attribute title is displayed as the header in the Object Page in bold. Attribute description is shown beneath title and if the optional imageUrl is given, then the picture will be visible on the left side of the title and description. If no url is given for the imageUrl, but typeImageUrl is defined, it will be displayed instead.
More Information:
- ABAP RESTful Application Programming Model - Defining the Table Header of a List Report
- ABAP RESTful Application Programming Model - Defining the Title Section of an Object Page
Search term: #HeaderFacet
The header facet is displayed in the header of an Object Page. The facet is annotated with UI.facet.purpose: #HEADER.
Note
Source: Metadata Extension /DMO/FSA_C_RootTP
@UI.facet: [
  // OPHEADER
  // Search Term #HeaderFacet, #KeyValue
  {
    purpose: #HEADER,
    type: #DATAPOINT_REFERENCE,
    targetQualifier: 'fieldWithPrice'
  }
]

// Search Term #HeaderFacet, #KeyValue
@UI.dataPoint: {
  qualifier: 'fieldWithPrice',
  title: 'Field with Price (#HeaderFacet)'
}
FieldWithPrice;
More Information: ABAP RESTful Application Programming Model - Using Facets to change the Object Page Layout
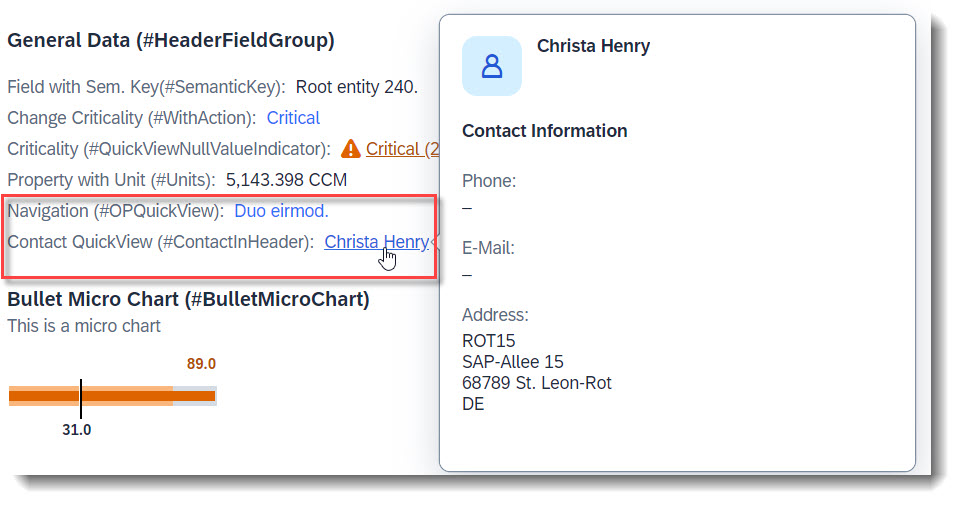
Search term: #HeaderFieldGroup, #ContactInHeader, #OPQuickView
Field groups can be part of a header.
Note
Source: Metadata Extension /DMO/FSA_C_RootTP
// Search Term #HeaderFieldGroup
@UI.facet: [
  {
    purpose: #HEADER
    label      : 'General Data (#HeaderFieldGroup)',
    type       : #FIELDGROUP_REFERENCE,
    targetQualifier: 'HeaderData'
  }
]
A quick view contact card can be displayed (#ContactInHeader). A QuickView can be displayed by just adding the property as a data field (#OPQuickView). Both implementations are identical to how they would be added as a line item in a List Report:
// Search Term #HeaderFieldGroup
@UI.fieldGroup: [
  {
    qualifier: 'HeaderData',
    position: 10,
    label: 'Field with Sem. Key(#SemanticKey)'
  }
]
StringProperty;

// Search Term #ContactInHeader, #HeaderFieldGroup
@UI.fieldGroup: [
  {
    qualifier: 'HeaderData',
    type: #AS_CONTACT,
    label: 'Contact QuickView (#ContactInHeader)',
    position: 70,
    value: '_Contact'
  }
]
ContactID;

// Search Term #HeaderFieldGroup, #WithAction
@UI.fieldGroup: [
  {
    qualifier: 'HeaderData',
    criticality: 'CriticalityCode',
    position: 20,
    label: 'Change Criticality (#WithAction)',
    dataAction: 'changeCriticality',
    type: #WITH_ACTION
  }
]
FieldWithCriticality;

// Search Term #HeaderFieldGroup, #OPQuickView
@UI.fieldGroup: [
  {
    qualifier: 'HeaderData',
    position: 50,
    label: 'Navigation QuickView (#OPQuickView)'
  }
]
NavigationID;
Search term: #SemanticKey
Semantic Key fields can be defined, with the annotation @ObjectModel.semanticKey, which consists of an array of properties from the entity. The given fields will be displayed in bold, and when possible the editing status will be displayed.
Note
Source: CDS View /DMO/FSA_R_RootTP
// Search Term #SemanticKey
@ObjectModel.semanticKey: ['StringProperty']
Search term: #PlainText
Plain text can be displayed, by adding a standard property to a field group and using this field group as a target of a reference facet.
The property in the field group can be optionally annotated with @UI.MultiLineText, especially if you have a long text and would like it to be show in the UI as a multi-line text, with an expand/collapse button.
Note
Source: Metadata Extension /DMO/FSA_C_RootTP
// Search Term #PlainText
@UI.facet: [
  {
    purpose: #HEADER,
    type: #FIELDGROUP_REFERENCE,
    label: 'Plain Text (#PlainText)',
    targetQualifier: 'plainText'
  }
]

@UI: {
  // Search Term #PlainText
  fieldGroup: [ { qualifier: 'plainText' } ]
  // Search Term #MultiLineText
  multiLineText: true
}
Description;
More Information: ABAP RESTful Application Programming Model - Grouping Fields
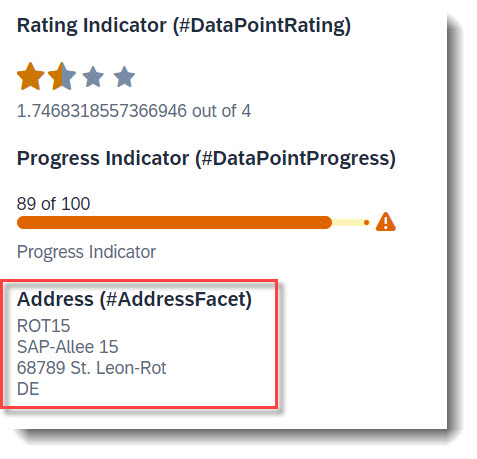
Search term: #AddressFacet
The property of an entity annotated with @Semantics.address.label can be directly displayed in an address facet, with target qualifier 'pref' if no specific qualifier is set. The label will be used as is, therefore it needs to be fully formatted. Linebreaks can be achieved with '\n'.
Note
Source: CDS View /DMO/FSA_I_Contact
// Search Term #CONTACT
define view entity /DMO/FSA_I_Contact
...
{
  ...
  @Semantics.address.label: true
  @Consumption.valueHelpDefault.display:false
  address_label as AddressLabel,
}
Note
Source: Metadata Extension /DMO/FSA_C_RootTP
// Search Term #AddressFacet
@UI.facet: [
  {
    purpose: #HEADER, // or #STANDARD
    label     : 'Address (#AddressFacet)',
    type      : #ADDRESS_REFERENCE,
    targetElement: '_Contact',
    targetQualifier: 'pref'
  }
]
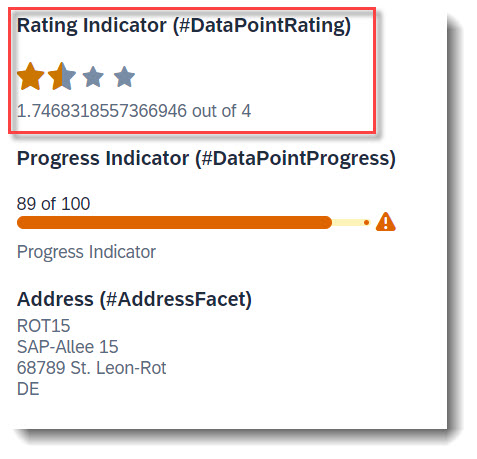
Search term: #DataPointRating
To add a rating indicator (stars) to the object page header, you first need to define a datapoint with @UI.dataPoint. The property where datapoint is defined sets how many stars are visible. Values between x.25 and x.74 are displayed as a half star. The attribute targetValue defines how many stars are possible. Most importantly, the qualifier needs to match the property name.
Note
Source: Metadata Extension /DMO/FSA_C_RootTP
@UI: {
  // Search Term #DataPointRating, #DataPointRatingTable
  dataPoint: {
    qualifier: 'StarsValue',
    targetValue: 4,
    visualization: #RATING,
    title: 'Rating Indicator (#DataPointRating)'
  }
}
StarsValue;
After creating the data point, it has to be added to the @UI.facet annotation.
@UI.facet: [
  {
    // Search Term #DataPointRating
    purpose: #HEADER, // or #STANDARD
    type       : #DATAPOINT_REFERENCE,
    targetQualifier: 'StarsValue'
  }
]
Example: ABAP RESTful Application Programming Model - Develop Node Extensions - Extension Node with Rating
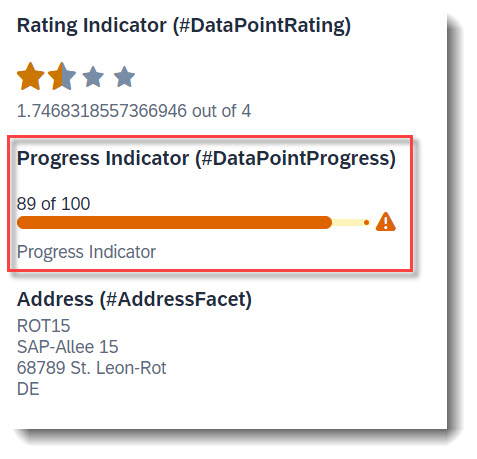
Search term: #DataPointProgress
To add a progress indicator to the object page header, you first need to define a datapoint with @UI.dataPoint. The property where datapoint is defined sets the current progress and the attribute targetValue, the maximum progress. Additionally, a criticality can be given, if wanted. Most importantly, the qualifier needs to match the property name.
Note
Source: Metadata Extension /DMO/FSA_C_RootTP
// Search Term #DataPointProgress, #DataPointProgressTable
@UI: {
  dataPoint: {
    qualifier: 'ProgressIntegerValue',
    targetValue: 100,
    visualization: #PROGRESS,
    criticality: 'CriticalityCode',
    title: 'Progress Indicator (#DataPointProgress)'
  }
}
ProgressIntegerValue;
After creating the data point, it has to be added to the @UI.facet annotation.
@UI.facet: [
  {
    // Search Term #DataPointProgress
    purpose: #HEADER, // or #STANDARD
    type       : #DATAPOINT_REFERENCE,
    targetQualifier: 'ProgressIntegerValue'
  }
]
Example: ABAP RESTful Application Programming Model - Develop Node Extensions - Extension Node with Progress
Search term: #KeyValue
A key value is the default data point, when the attribute visualization is not specified in @UI.dataPoint.
Note
Source: Metadata Extension /DMO/FSA_C_RootTP
@UI.facet: [
  // Search Term #Headerfacet, #KeyValue
  {
    purpose: #HEADER,
    type: #DATAPOINT_REFERENCE,
    targetQualifier: 'fieldWithPrice'
  }
]

@UI: {
  // Search Term #HeaderFacet, #KeyValue
  dataPoint: {
    qualifier: 'fieldWithPrice',
    title: 'Field with Price (#HeaderDataPoint)'
  }
}
FieldWithPrice;
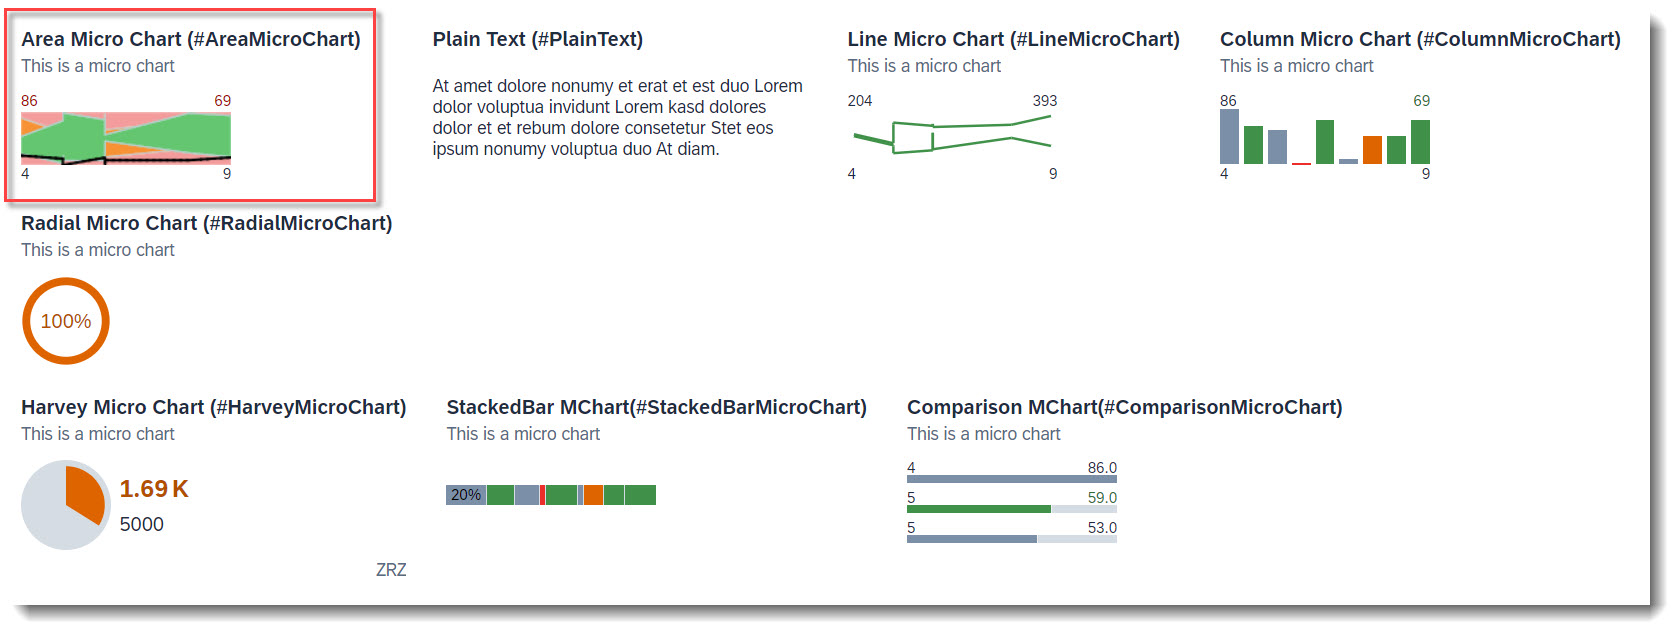
The following micro charts are supported: Area, Bullet, Radial, Column, Line, Harvey, Stacked bar and Comparison. Micro charts can only be displayed in the header.
A micro chart is defined with the @UI.chart annotation, which then is the target of a ReferenceFacet in the @UI.facet of purpose: #HEADER. The title of the facet is the attribute title of the annotation and the subtitle is description. If the property of the data point is a property with unit of measure, the unit will be displayed in the footer. The attribute measures of the chart has to be a data point.
The @UI.dataPoint supports generally the attributes criticality and criticalityCalculation, but the support varies between the micro chart types. If the value of the data point is annotated with a unit of measure, the unit will be shown as the footer of the micro chart facet.
In the following examples, all used attributes are mandatory.
Search term: #AreaMicroChart
The area micro chart is a trend chart, which provides information for the actual and target value for a specified dimension. The displayed values at the bottom of the chart are the boundary values of the dimension. The values above the chart are the boundary values of the measure attribute.
Note
Source: Metadata Extension /DMO/FSA_C_ChartTP
@UI.chart: [
  // Search Term #AreaMicroChart
  {
    qualifier: 'areaChart',
    title: 'Area Micro Chart (#AreaMicroChart)',
    description: 'This is a micro chart',
    chartType: #AREA,
    dimensions: ['Dimensions'],
    measures: ['IntegerValueForAreaChart'],
    measureAttributes: [
      {
        measure: 'IntegerValueForAreaChart',
        role: #AXIS_1,
        asDataPoint: true
      }
    ]
  }
]
The criticality calculation of the data point is mandatory, as each value is shown with its threshold (error, warning, acceptance and good) ranges.
// Search Term #AreaMicroChart
@UI.dataPoint: {
  qualifier: 'IntegerValueForAreaChart',
  targetValueElement: 'TargetValue',
  criticalityCalculation: {
    improvementDirection: #TARGET,
    toleranceRangeLowValueElement: 'AreachartTolLowerboundValue',
    toleranceRangeHighValueElement: 'AreachartTolUpperboundValue',
    deviationRangeHighValueElement: 'AreachartDevUpperboundValue',
    deviationRangeLowValueElement: 'AreachartDevLowerboundValue'
  }
}
IntegerValueForAreaChart;
Note
Source: Metadata Extension /DMO/FSA_C_RootTP
// Search Term #AreaMicroChart
@UI.facet: [
  {
    purpose: #HEADER,
    type       : #CHART_REFERENCE,
    targetQualifier: 'areaChart',
    targetElement: '_Chart'
  }
]
More Information: ABAP RESTful Application Programming Model: Visualizing Data with Charts
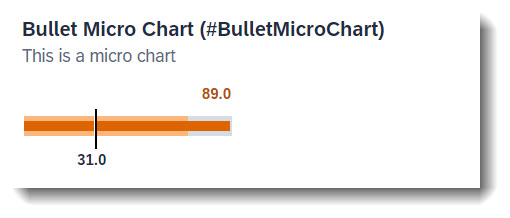
Search term: #BulletMicroChart
The bullet chart features a single measure and compares it to one or more other measures (e.g. value with target comparison). Both criticality and criticalityCalculation are supported, but if both are given criticality overrides criticalityCalculation. The bullet chart does not support the criticality value of 5 (new item). The measuresAttributes, while it is mandatory, has no effect on the chart as the values come from datapoint.
Note
Source: Metadata Extension /DMO/FSA_C_RootTP
Chart
// Search Term #BulletMicroChart, #BulletMicroChartTable
@UI.chart: [
  {
    qualifier: 'bulletChart',
    title: 'Bullet Micro Chart (#BulletMicroChart)',
    description: 'This is a micro chart',
    chartType: #BULLET,
    measures: ['IntegerValue'],
    measureAttributes: [
      {
        measure: 'IntegerValue',
        role: #AXIS_1,
        asDataPoint: true
      }
    ]
  }
]
Facet
// Search Term #BulletMicroChart
@UI.facet: [
  {
    purpose: #HEADER,
    type       : #CHART_REFERENCE,
    targetQualifier: 'bulletChart'
  }
]
Data Point. The attribute minimumValue is needed to render the chart properly. The value is the actual bar. The forecastValue is the bar in the background with a lower opacity and the targetValue is the dark line. Qualifier must be set to the name of the property.
// Search Term: #BulletMicroChart
@UI.dataPoint: {
  qualifier: 'IntegerValue', //IntegerValue: horizontal bar in relation to the goal line
  targetValueElement: 'TargetValue', //visual goal line in the UI
  forecastValue: 'ForecastValue', //horizontal bar behind the value bar with, slightly larger with higher transparency
  criticality: 'CriticalityCode',
  minimumValue: 0 //Minimal value, needed for output rendering
}
IntegerValue;
More Information: ABAP RESTful Application Programming Model: Visualizing Data with Charts
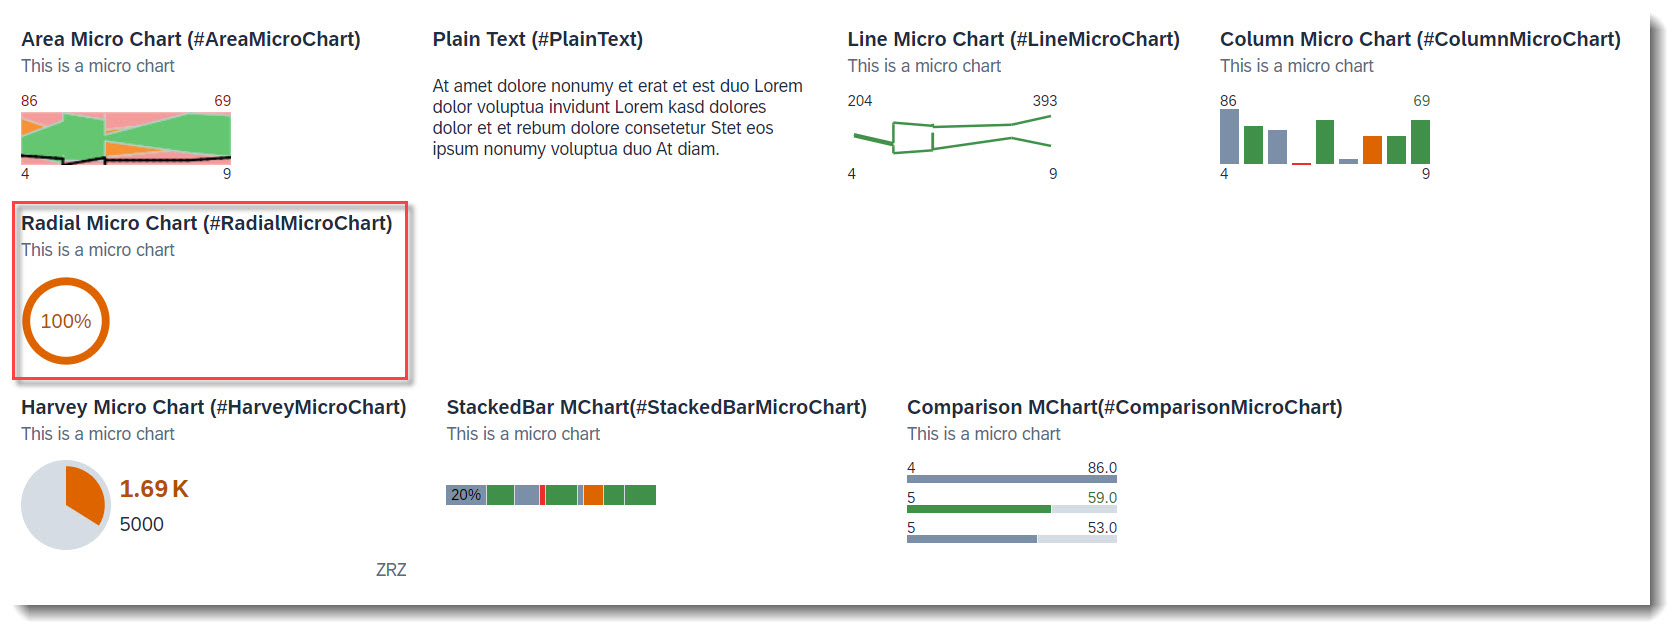
Search term: #RadialMicroChart
The radial micro chart displays a single percentage value. The measureAttributes, while mandatory, has no effect on the chart as the values come from datapoint.
Note
Source: Metadata Extension /DMO/FSA_C_RootTP
Chart
// Search Term #RadialMicroChart
@UI.chart: [
  {
    qualifier: 'radialChart',
    title: 'Radial Micro Chart (#RadialMicroChart)',
    description: 'This is a micro chart',
    chartType: #DONUT,
    measures: ['RadialIntegerValue'],
    measureAttributes: [
      {
        measure: 'RadialIntegerValue',
        role: #AXIS_1,
        asDataPoint: true
      }
    ]
  }
]
Facet
// Search Term #RadialMicroChart
@UI.facet: [
  {
    purpose: #HEADER,
    type       : #CHART_REFERENCE,
    targetQualifier: 'radialChart'
  }
]
Data Point. The percentage value is the fraction of the property value and the target value. The unit of measure label will not be rendered, as the chart displays percentage values. Both criticality and criticalityCalculation are supported, but if both are given criticality overrides criticalityCalculation. Qualifier must be set to the name of the property.
// Search Term #RadialMicroChart
@UI.dataPoint: {
  qualifier: 'RadialIntegerValue',
  targetValueElement: 'TargetValue', //The relation between the value and the target value will be displayed as a percentage
  criticality: 'CriticalityCode'
}
RadialIntegerValue;
More Information: ABAP RESTful Application Programming Model: Visualizing Data with Charts
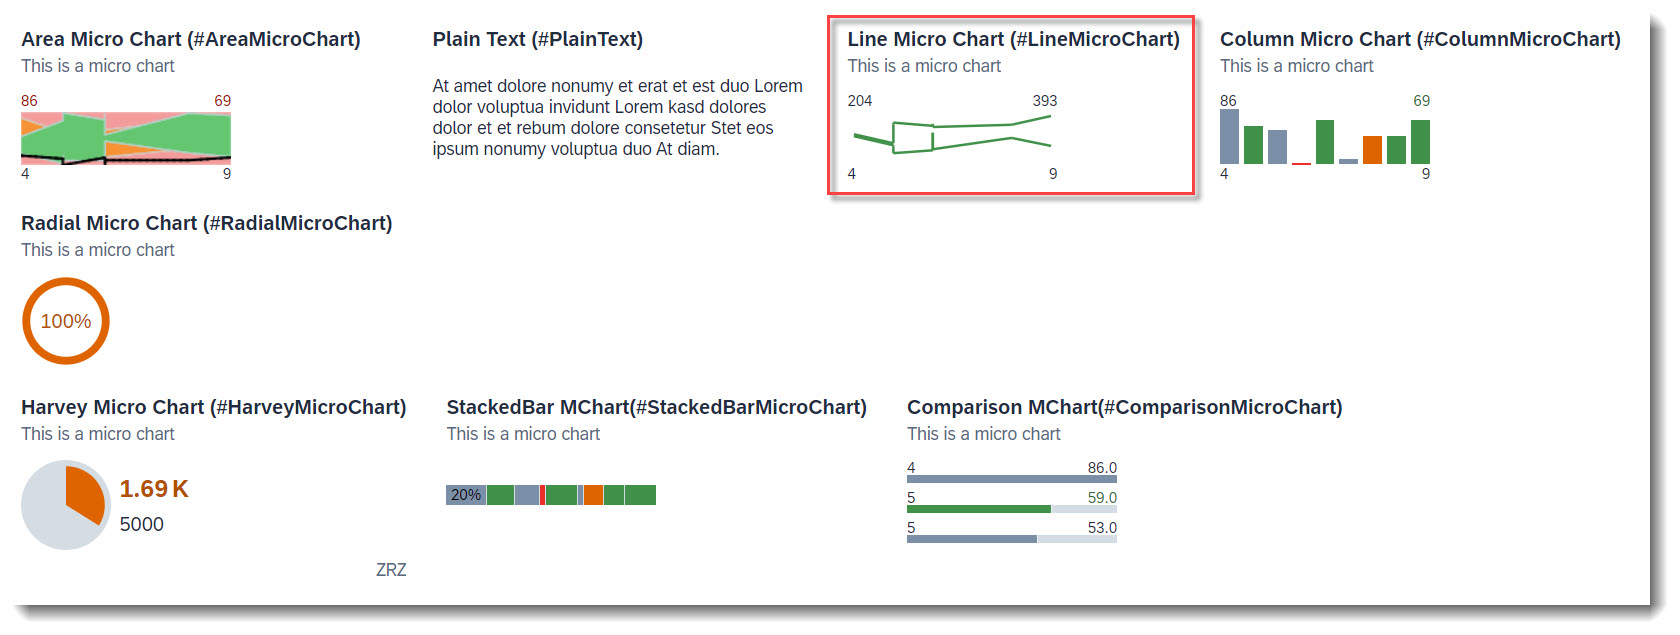
Search term: #LineMicroChart
The line chart displays a series of data points as a line. The bottom values are the border values of the dimension. The upper left value is the smallest value of the first measures property and the upper right value is the largest value of the last measures property. The shown unit of measure is from the first entry.
Note
Source: Metadata Extension /DMO/FSA_C_ChartTP
// Search Term #LineMicroChart
@UI.chart: [
  {
    qualifier: 'lineChart',
    title: 'Line Micro Chart (#LineMicroChart)',
    description: 'This is a micro chart',
    chartType: #LINE,
    measures: ['IntegerValueForLineChart', 'TargetValue'],
    dimensions: ['Dimensions'],
    measureAttributes: [
      {
        measure: 'IntegerValueForLineChart',
        role: #AXIS_2,
        asDataPoint: true
      },
      {
        measure: 'TargetValue',
        role: #AXIS_2,
        asDataPoint: true
      }
    ]
  }
]
Data Points. It is recommended to only use one measure, and a maximum of three measures, if more is required. If the attribute criticality contains a path, then the value of the last data point's criticality determines the color of the line.
// Search Term #LineMicroChart
@UI: {
  dataPoint: {
    qualifier: 'TargetValue',
    criticality: 'CriticalityCode'
  }
}
TargetValue;

// Search Term #LineMicroChart
@UI.dataPoint: {
  qualifier: 'IntegerValueForLineChart',
  criticality: 'CriticalityCode'
}
IntegerValueForLineChart;
Note
Source: Metadata Extension /DMO/FSA_C_RootTP
// Search Term #LineMicroChart
@UI.facet: [
  {
    purpose: #HEADER,
    type: #CHART_REFERENCE,
    targetQualifier: 'lineChart',
    targetElement: '_Chart'
  }
]
More Information: ABAP RESTful Application Programming Model: Visualizing Data with Charts
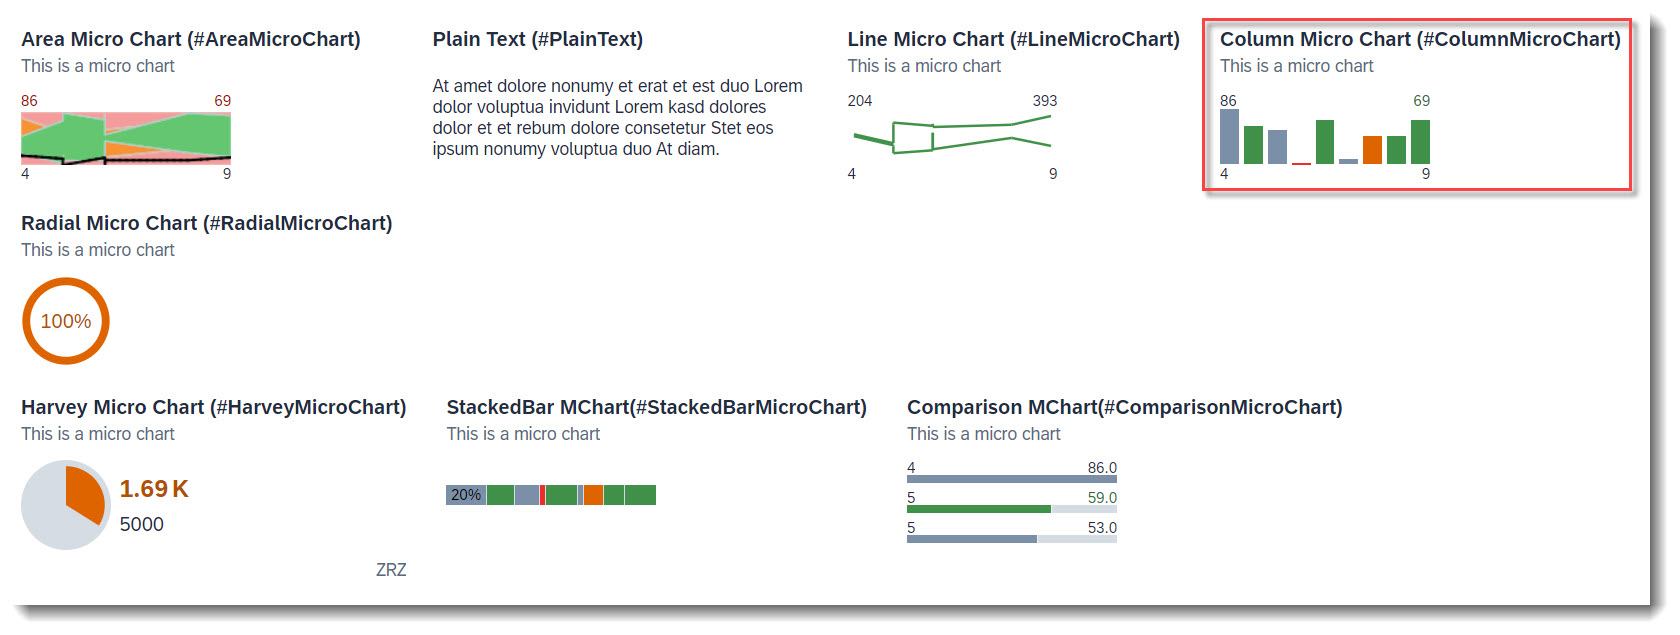
Search term: #ColumnMicroChart
A column chart uses vertical bars to compare values of a dimension. The displayed values at the bottom of the chart are the boundary values of the dimensions. The values above the chart are the boundary values of the measureAttributes.
Note
Source: Metadata Extension /DMO/FSA_C_ChartTP
// Search Term #ColumnMicroChart
@UI.chart: [
  {
    qualifier: 'columnChart',
    title: 'Column Micro Chart (#ColumnMicroChart)',
    description: 'This is a micro chart',
    chartType: #COLUMN,
    measures: ['IntegerValueForOtherCharts'],
    dimensions: ['Dimensions'],
    measureAttributes: [
      {
        measure: 'IntegerValueForOtherCharts',
        role: #AXIS_1,
        asDataPoint: true
      }
    ]
  }
]
Data Point. Both criticality and criticalityCalculation are supported, but if both are given criticality overrides criticalityCalculation.
// Search Term #ColumnMicroChart, #StackedBarMicroChart, #ComparisonMicroChart
@UI.dataPoint: {
  qualifier: 'IntegerValueForOtherCharts',
  criticality: 'CriticalityCode'
}
IntegerValueForOtherCharts;
Note
Source: Metadata Extension /DMO/FSA_C_RootTP
// Search Term #ColumnMicroChart
@UI.facet: [
  {
    purpose: #HEADER,
    type: #CHART_REFERENCE,
    targetQualifier: 'columnChart',
    targetElement: '_Chart'
  }
]
More Information: ABAP RESTful Application Programming Model: Visualizing Data with Charts
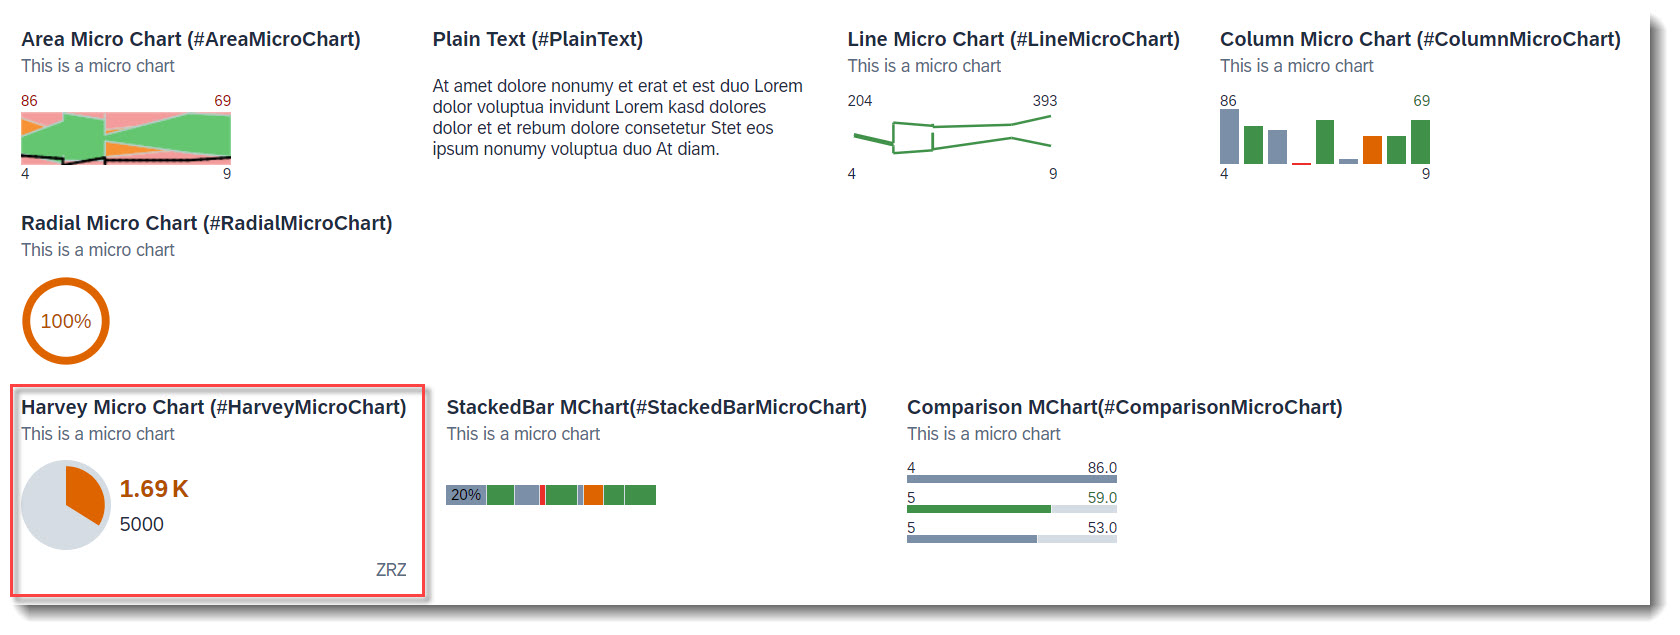
Search term: #HarveyMicroChart
A harvey chart plots a single measure value against a maximum value.
Note
Source: Metadata Extension /DMO/FSA_C_RootTP
Chart
// Search Term #HarveyMicroChart
@UI.chart: [
  {
    qualifier: 'harveyChart',
    title: 'Harvey Micro Chart (#HarveyMicroChart)',
    description: 'This is a micro chart',
    chartType: #PIE,
    measures: ['HarveyFieldWithPrice'],
    measureAttributes: [
      {
        measure: 'HarveyFieldWithPrice',
        role: #AXIS_1,
        asDataPoint: true
      }
    ]
  }
]
Data Point. For the semantic coloring, only the attribute criticality is supported.
//Search-Term: #HarveyMicroChart
@UI.dataPoint: {
  qualifier: 'HarveyFieldWithPrice',
  maximumValue: 5000,
  criticality: 'CriticalityCode'
}
HarveyFieldWithPrice;
Facet
// Search Term #HarveyMicroChart
@UI.facet: [
  {
    purpose: #HEADER,
    type: #CHART_REFERENCE,
    targetQualifier: 'harveyChart'
  }
]
More Information: ABAP RESTful Application Programming Model: Visualizing Data with Charts
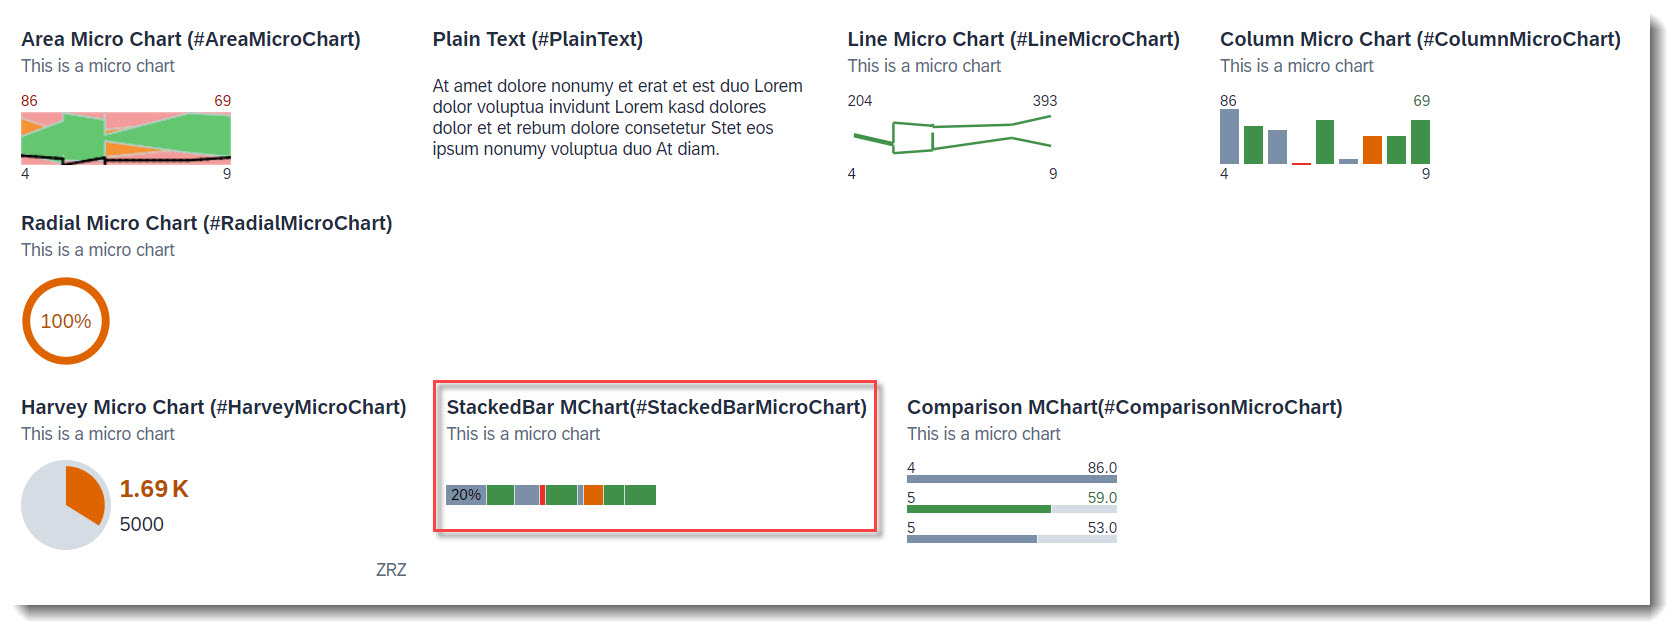
Search term: #StackedBarMicroChart
A stacked bar chart uses vertical bars to compare values of a dimension. The displayed values at the bottom of the chart are the boundary values of the dimensions. The values above the chart are the boundary values of the measureAttributes.
Note
Source: Metadata Extension /DMO/FSA_C_ChartTP
// Search Term #StackedBarMicroChart
@UI.chart: [ {
  qualifier: 'stackedBarChart',
  title: 'StackedBar Micro Chart (#StackedBarMicroChart)',
  description: 'This is a micro chart',
  chartType: #BAR_STACKED,
  measures: ['IntegerValueForOtherCharts'],
  dimensions: ['Dimensions'],
  measureAttributes: [
    {
      measure: 'IntegerValueForOtherCharts',
      role: #AXIS_1,
      asDataPoint: true
    }
  ]
}]
Data Point. Both criticality and criticalityCalculation are supported, but if both are given criticality overrides criticalityCalculation.
// Search Term #ColumnMicroChart, #StackedBarMicroChart, #ComparisonMicroChart
@UI.dataPoint: {
  qualifier: 'IntegerValueForOtherCharts',
  criticality: 'CriticalityCode'
}
IntegerValueForOtherCharts;
Note
Source: Metadata Extension /DMO/FSA_C_RootTP
// Search Term #StackedBarMicroChart
@UI.facet: [
  {
    purpose: #HEADER,
    type: #CHART_REFERENCE,
    targetQualifier: 'stackedBarChart',
    targetElement: '_Chart'
  }
]
More Information: ABAP RESTful Application Programming Model: Visualizing Data with Charts
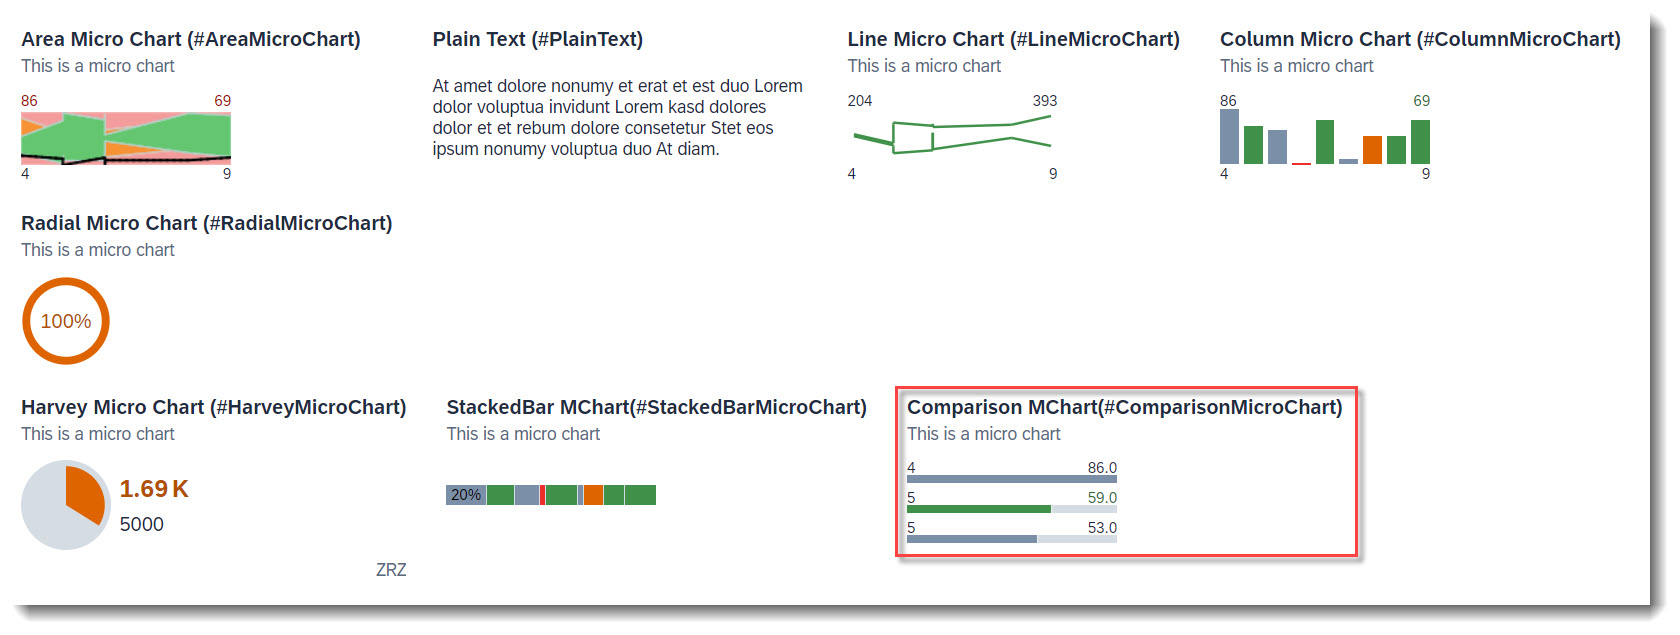
Search term: #ComparisionMicroChart
A comparison chart uses three horizontal bars to compare values of a dimension. If more values are defined in dimensions, they will only show up in the tooltip. The displayed values on the left represent the dimension value of each data point. The values on the right are the actual values. If a unit of measure is shown, then it is from the first data point to be plotted.
Note
Source: Metadata Extension /DMO/FSA_C_ChartTP
// Search Term #ComparisonMicroChart
@UI.chart: [
  {
    qualifier: 'comparisonChart',
    title: 'Comparison Micro Chart (#ComparisonMicroChart)',
    description: 'This is a micro chart',
    chartType: #BAR,
    measures: ['IntegerValueForOtherCharts'],
    dimensions: ['Dimensions'],
    measureAttributes: [
      {
        measure: 'IntegerValueForOtherCharts',
        role: #AXIS_1,
        asDataPoint: true
      }
    ]
  }
]
Data Point. For semantic coloring, only the attribute criticality is supported.
// Search Term #ColumnMicroChart, #StackedBarMicroChart, #ComparisonMicroChart
@UI.dataPoint: {
  qualifier: 'IntegerValueForOtherCharts',
  criticality: 'CriticalityCode'
}
IntegerValueForOtherCharts;
Note
Source: Metadata Extension /DMO/FSA_C_RootTP
// Search Term #ComparisonMicroChart
@UI.facet: [
  {
    purpose: #HEADER,
    type: #CHART_REFERENCE,
    targetQualifier: 'comparisonChart',
    targetElement: '_Chart'
  }
]
More Information: ABAP RESTful Application Programming Model: Visualizing Data with Charts
Search term: #OPCopyAction
Warning
Only available with the latest SAP BTP or SAP S/4HANA Cloud, public edition release and for SAP S/4HANA, on-premise edition or SAP S/4HANA Cloud, private edition, from release 2023 onwards.
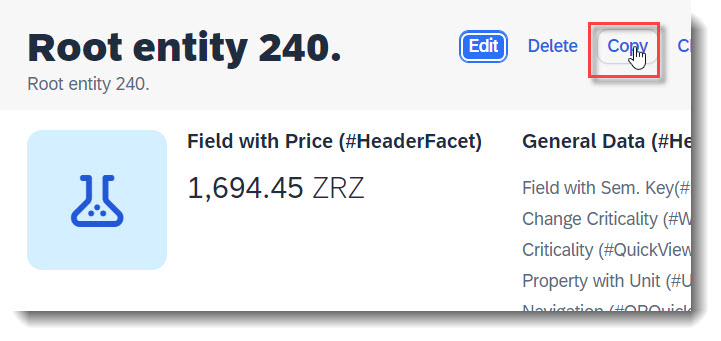
For a deep copy of an instance, the RAP framework does not provide a copy action out of the box, unlike create/edit/delete. However you can define a factory action in the BDEF that copies an instance, and by using the keyword isCopyAction: true, the action button will be rendered in UI harmoniously with Edit/Delete.
The cardinality of a factory action is always [1], that means, only one instance can be copied at a time.
When no label is provided, it is automatically set to 'Copy'.
Note
Source: Metadata Extension /DMO/FSA_C_RootTP
@UI.identification: [
  // Search Term #OPCopyAction
  {
    type:#FOR_ACTION,
    dataAction: 'copyInstance',
    isCopyAction: true
  }
]
Note
Source: Behaviour Definition /DMO/FSA_R_RootTP
factory action copyInstance [1];
Search term: #OPHeaderAction
Actions for the Object Page in general are annotated using @UI.identification. The criticality only supports the values 0 (normal), 1 (red) and 3 (green). For normal actions the Object Page content is passed and for static actions, no context is passed.
Note
Source: Metadata Extension /DMO/FSA_C_RootTP
// Search Term #OPHeaderAction
@UI.identification: [
  {
    type: #FOR_ACTION,  //Action in the RootEntities of the object page next to the edit button
    label: 'Change Criticality (#OPHeaderAction)',
    criticality: 'CriticalityCode',
    criticalityRepresentation: #WITH_ICON,
    dataAction: 'changeCriticality'
  }
]
ID;
Note
Source: Behaviour Definition /DMO/FSA_R_RootTP
action changeCriticality parameter /DMO/FSA_D_ChangeCriticalityP result [1] $self;
More Information: ABAP RESTful Application Programming Model: Action Implementation - UI Consumption of actions
Search term: #DynamicCRUD
Warning
Only available with the latest SAP BTP or SAP S/4HANA Cloud, public edition release and for SAP S/4HANA, on-premise edition or SAP S/4HANA Cloud, private edition, from release 2023 onwards.
The visibility of the "Edit", "Create" and "Delete" buttons in the Object Page can be dynamically adjusted. For example the delete operation can be dependent on a property of the entity, through the annotation @UI.deleteHidden. Fixed values true or false are also possible.
Note
Source: Metadata Extension /DMO/FSA_C_RootTP
// Search Term #DynamicCRUD
@UI.updateHidden: #(UpdateHidden)
@UI.deleteHidden: #(DeleteHidden)
Search term: #WithActionInOP
Warning
Only available with the latest SAP BTP or SAP S/4HANA Cloud, public edition release and for SAP S/4HANA, on-premise edition or SAP S/4HANA Cloud, private edition, from release 2023 onwards.
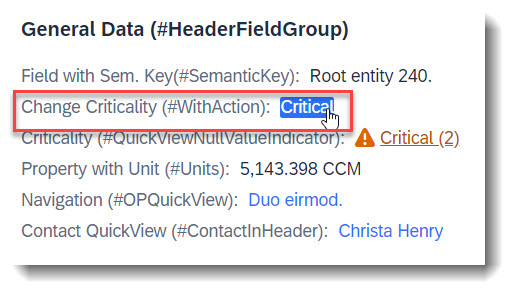
An action that is tied to a data value, which would be rendered as a hyperlink. Therefore it is crucial to specify the annotation at the desired element which has the data value.
The keyword to use for this is type: #WITH_ACTION.
Note
Source: Metadata Extension /DMO/FSA_C_RootTP
@UI.facet: [
  // Search Term #HeaderCollectionFacet
  {
    purpose: #HEADER,
    id: 'FacetCollection',
    type: #COLLECTION
  },
  // Search Term #HeaderFieldGroup
  {
    parentId   : 'FacetCollection',
    label      : 'General Data (#HeaderFieldGroup)',
    type       : #FIELDGROUP_REFERENCE,
    targetQualifier: 'HeaderData'
  }
]

@UI: {
  fieldGroup: [
    // Search Term #HeaderFieldGroup, #WithActionInOP
    {
      qualifier: 'HeaderData',
      criticality: 'CriticalityCode',
      position: 30,
      label: 'Change Criticality (#WithActionInOP)',
      dataAction: 'changeCriticality',
      type: #WITH_ACTION
    }
  ]
}
FieldWithCriticality;
Note
Source: Behaviour Definition /DMO/FSA_R_RootTP
action changeCriticality parameter /DMO/FSA_D_ChangeCriticalityP result [1] $self;
