Cookbook
This vignette contains a series of examples showing how to initialize the safetyGraphics Shiny app in different scenarios. For a general overview of the app see this vignette. For more details about adding custom charts, see this vignette.
safetyGraphics requires R v4 or higher. These examples have been tested using RStudio v1.4, but should work on other platforms with proper configuration.
You can install {safetyGraphics} from CRAN like any other R package:
install.packages("safetyGraphics")
library("safetyGraphics")
Or to use the most recent development version from GitHub, call:
devtools::install_github("safetyGraphics/safetyCharts", ref="dev")
library(safetyCharts)
devtools::install_github("safetyGraphics/safetyGraphics", ref="dev")
library(safetyGraphics)
safetyGraphics::safetyGraphicsApp()
To run the app with no customizations using sample AdAM data from the {safetyData} package, install the package and run:
safetyGraphics::safetyGraphicsApp()
The data passed in to the safetyGraphics app can be customized using the data parameter in safetyGraphicsApp(). For example, to run the app with SDTM data saved in {safetyData}, call:
sdtm <- list(
    dm=safetyData::sdtm_dm,
    aes=safetyData::sdtm_ae,
    labs=safetyData::sdtm_lb
)

safetyGraphics::safetyGraphicsApp(domainData=sdtm)
Running the app for a single data domain, is similar:
justLabs <- list(labs=safetyData::adam_adlbc)
safetyGraphics::safetyGraphicsApp(domainData=justLabs)
Note that charts with missing data are automatically dropped and the filtering tab is not present since it requires demographics data by default.
Users can also generate a list of charts and then drop charts that they don't want to include. For example, if you wanted to drop charts with type of "htmlwidgets" you could run this code.
library(purrr)
charts <- makeChartConfig() #gets charts from safetyCharts pacakge by default
notWidgets <- charts %>% purrr::keep(~.x$type != "htmlwidget")
safetyGraphicsApp(charts=notWidgets)
For more information about chart customization, including details on how to add new charts, see this vignette. #TODO ADD LINK
Finally, let's consider how we would start the app for non-standard data. {safetyGraphics} automatically detects AdAM and SDTM data when possible, but for non-standard data, the user must provide a data mapping. This can be done in the app using the data/mapping tab, or can be done when the app is initialized by passing a mapping data.frame to safetyGraphicsApp(). For example:
notAdAM <- list(labs=safetyData::adam_adlbc %>% rename(id = USUBJID))
idMapping<- data.frame(domain="labs", text_key="id_col", current="id")
safetyGraphicsApp(data=notAdam, mapping=idMapping)
Note that the source code to generate the current mapping in the app is available under the settings/metadata tab.
For a more realistic example, consider this labs data set (csv). The data can be loaded in to safetyGraphics with the code below, but several items in the mapping page need to be filled in:
labs <- read.csv("https://raw.githubusercontent.com/SafetyGraphics/SafetyGraphics.github.io/master/pilot/SampleData_NoStandard.csv")
safetyGraphics::safetyGraphicsApp(domainData=list(labs=labs))
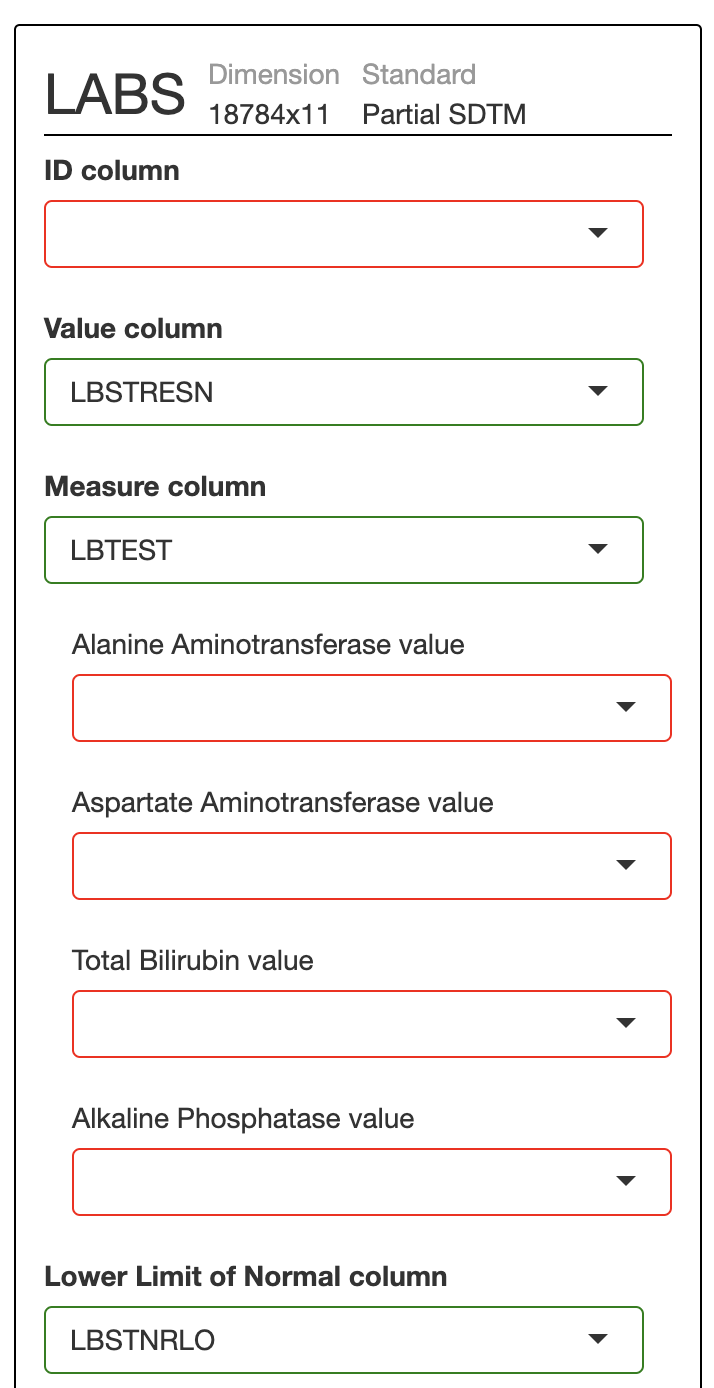
After filling in these values, you can click on the setting icon in the header, then metadata and finally on the code sub-header, to see this view:

The code on this page can then be used to restart the app with the specified settings pre-populated. The final code looks like this:
customMapping<-
structure(list(
    domain = c("labs", "labs", "labs", "labs", "labs",
"labs", "labs", "labs", "labs", "labs", "labs", "labs", "labs",
"labs", "labs", "labs", "labs", "labs", "labs"),
    text_key = c("id_col",
"value_col", "measure_col", "measure_values--ALT", "measure_values--AST",
"measure_values--TB", "measure_values--ALP", "normal_col_low",
"normal_col_high", "studyday_col", "visit_col", "visitn_col",
"unit_col", "baseline_flag_col", "baseline_flag_values", "analysis_flag_col",
"analysis_flag_values", "detail_col", "filter_cols"),
    current = c("ID",
"LBSTRESN", "LBTEST", "Aminotransferase, alanine (ALT)", "Aminotransferase, aspartate (AST)",
"Total Bilirubin", "Alkaline phosphatase (ALP)", "LBSTNRLO",
"LBSTNRHI", "LBDY", "VIS", "VISN", "LBSTRESU", "", "", "", "",
"", "")),
    row.names = c(NA, -19L),
    class = "data.frame") # call `safetyGraphics(mapping=customMapping)` to restart the app using this mapping

safetyGraphics::safetyGraphicsApp(
    domainData=list(labs=labs),
    mapping=customMapping
)