Network Monitoring
Because PhantomJS permits the inspection of network traffic, it is suitable to build various analysis on the network behavior and performance.
All the resource requests and responses can be sniffed using onResourceRequested and onResourceReceived. A very simple to log every request and response is illustrated in the example script netlog.js:
var page = require('webpage').create();
page.onResourceRequested = function (request) {
console.log('Request ' + JSON.stringify(request, undefined, 4));
};
page.onResourceReceived = function (response) {
console.log('Receive ' + JSON.stringify(response, undefined, 4));
};
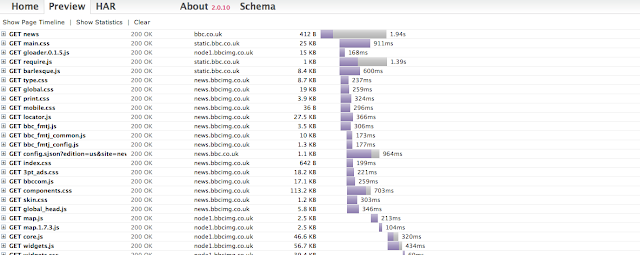
page.open(url);By collecting the data and reformatting it, another example, netsniff.js, exports the network traffic in HAR format. Use HAR viewer to visualize the result and get the waterfall diagram.
The following shows an examplary waterfall diagram obtained from BBC website:
For more advanced network analysis, see projects like Confess.js and YSlow.
The integration of YSlow and PhantomJS is very useful for automated web performance. The report can be in TAP (Test Anything Protocol) and JUnit. Running YSlow with PhantomJS in a continuous integration system such as Jenkins is an easy DIY solution to performance monitoring:
