Analysis of performance with benchmarks
Lumberjack was designed from the start to be fast. And fast it is! The project itself comes with a suite of benchmarking tests. With a simple build-and-go in Xcode you can run them yourself. But the main reason the benchmarking tests are there is so the project maintainers never neglect the performance factor.
But what makes lumberjack so fast?
Lumberjack takes advantage of grand central dispatch (GCD) if it is available on the target platform. For example, the framework will execute each individual logger concurrently. This means that the framework can write log messages to the console and a file at the same time, using multiple CPU cores. And GCD optimizes all this multi-threading for us automatically, meaning the framework can scale from 1 CPU core to 100.
If GCD is not available, Lumberjack still performs excellently using traditional multi-threaded optimizations.
Lumberjack has the ability to execute certain log statements asynchronously. (This is, of course, optional and you can disable it or fine-tune it as you see fit.)
The default philosophy for asynchronous logging is very simple:
- Log messages with errors should be executed synchronously.
After all, an error just occurred. The application could be unstable.\
- All other log messages, such as debug output, are executed asynchronously.
After all, if it wasn't an error, then it was just informational output, or something the application was easily able to recover from.
This is easily configurable. And the performance of the library does not solely rely on asynchronous logging.
The simple truth is that NSLog is just plain slow.
But why? To answer that question, let's find out what NSLog does, and then how it does it.
What does NSLog do exactly?
NSLog does 2 things:
- It writes log messages to the Apple System Logging (asl) facility. This allows log messages to show up in Console.app.
- It also checks to see if the application's stderr stream is going to a terminal (such as when the application is being run via Xcode). If so it writes the log message to stderr (so that it shows up in the Xcode console).
Writing to STDERR doesn't sound difficult. That can be accomplished with fprintf and the stderr file descriptor reference. But what about asl?
The best documentation I've found about ASL is a 10 part blog post from Peter Hosey: link
Without going into too much detail, the highlight (as it concerns performance) is this:
To send a log message to the ASL facility, you basically open a client connection to the ASL daemon and send the message. BUT - each thread must use a separate client connection. So, to be thread safe, every time NSLog is called it opens a new asl client connection, sends the message, and then closes the connection. (1)
The lumberjack framework avoids much of the cost by creating a single re-usable asl client connection for its background logging thread.
^1 - Assuming that NSLog acts like its open-source cousin CFShow.
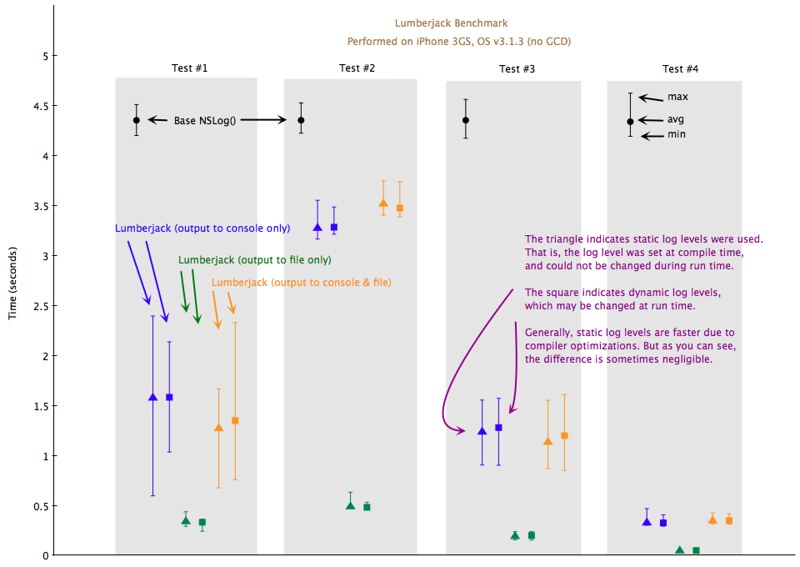
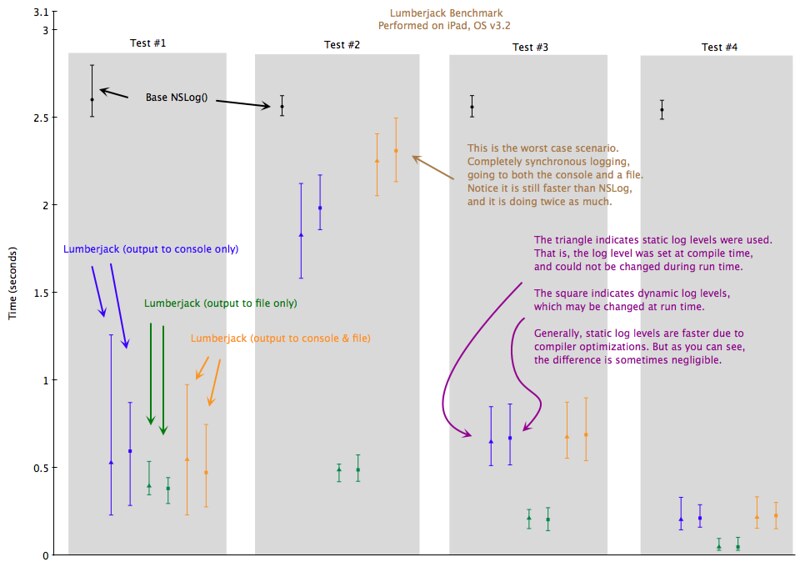
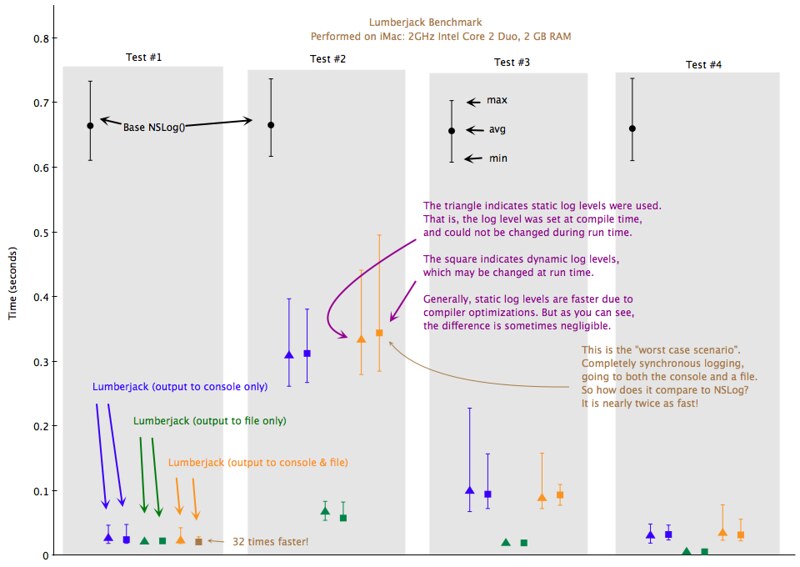
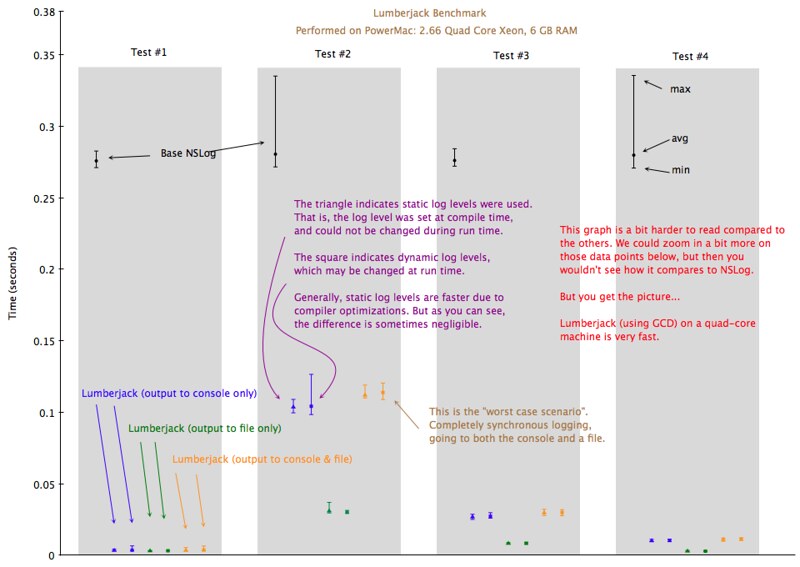
As mentioned earlier, the Lumberjack framework comes with a suite of benchmarking tests. You can run these benchmark tests yourself using the "BenchmarkMac" or "BenchmarkIPhone" Xcode projects. When you build-and-go, the project will output the results to the Xcode console in a human-readable format at the end of the benchmarking process. It will also output a CSV file in case you wanted to graph the results.
There are 4 main tests. The base case for each test is a standard NSLog statement. Each test is run 20 times, from which a min, max and average time is calculated. The benchmark includes various configurations of the Lumberjack framework, such as:
- logging to the console only
- logging to a file only
- logging to the console & file at the same time
Asynchronous logging test. Execute 1,000 log statements. All lumberjack log statements are queued onto a background logging thread.
Synchronous logging test. Execute 1,000 log statements. All lumberjack log statements are executed synchronously. They may still be executed on a background logging thread, but the original log statement does not return until the logging has completed.
Real life simulation with an even spread of log statements across various levels. Execute 1,000 log statements. 25% will be above the log level and will be filtered out. 50% will be executed asynchronously. 25% will be executed synchronously.
Real life simulation with an abundance of debug log statements. Execute 1,000 log statements. 90% will be filtered out. 10% will be error messages, executed synchronously.
The numbers for test #4 came from some projects that I've worked on in the past. A bit of regex revealed that 90% of my log statements were debug messages. The other 10% were spread among the various other levels, but I wanted the benchmark test to be "worst case" with respect to this 10%.
Note that all of these benchmark test are configurable. So if you wanted to try, for example, test #4 with different percentages, you can easily change the test yourself.


