-
Notifications
You must be signed in to change notification settings - Fork 1
3. Custom Extensions
In the previous chapters, we learned how to create and deploy a CAP-based SaaS application.
Now, let's switch roles and put ourselves in the shoes of a SaaS customer, specifically an extension developer named bob. Bob's task is to extend the subscribed Incidents Management app to customize it according to the specific needs of customer t1.
Customer t1 is a vendor of Solar Panels, primarily targeting private homeowners. As part of the extension, Bob needs to incorporate additional information when creating incidents, such as affected components (e.g., panels, batteries, controller units, etc.), panel orientations, weather conditions, and more.
The following sections provide an overview of the SaaS Extensibility guide in capire.
To test-drive and validate the extension before activating it in production, bob asks his administrator alice to create a test tenant. In our local setup, we simulate this process as follows:
- Set up a test tenant
t1-extby entering the following command in the terminal:
cds subscribe t1-ext --to http://localhost:4005 -u alice-
Assign extension developers for the test tenant. Since we’re using mocked auth, we can mock this step by adding the following lines to the base app’s
package.json, which assignsbobas the extension developer fort1-ext:"cds": { "requires": { ..., "auth": { "users": { "bob": { "tenant": "t1-ext", "roles": ["cds.ExtensionDeveloper"] } } } } }
👉 Copy and insert the respective lines in the correct location in the package.json file. Remember to restart both the MTX sidecar and the base application before proceeding.
SaaS providers typically offer project-specific guides and templates for extensions. In our case, we have provided a project template for the incidents management sample, which can be found in the mono repo at ./x-t1 (GitHub link). For this exercise, we will open that project in a new BAS window:
-
Open a new BAS window: Menu > File > New Window (refer to exercise 1 for detailed instructions)
-
Open the cloned sub-project
extensibility-sample/t1x(also covered in exercise 1) -
After completing these steps, your browser window should resemble the following:
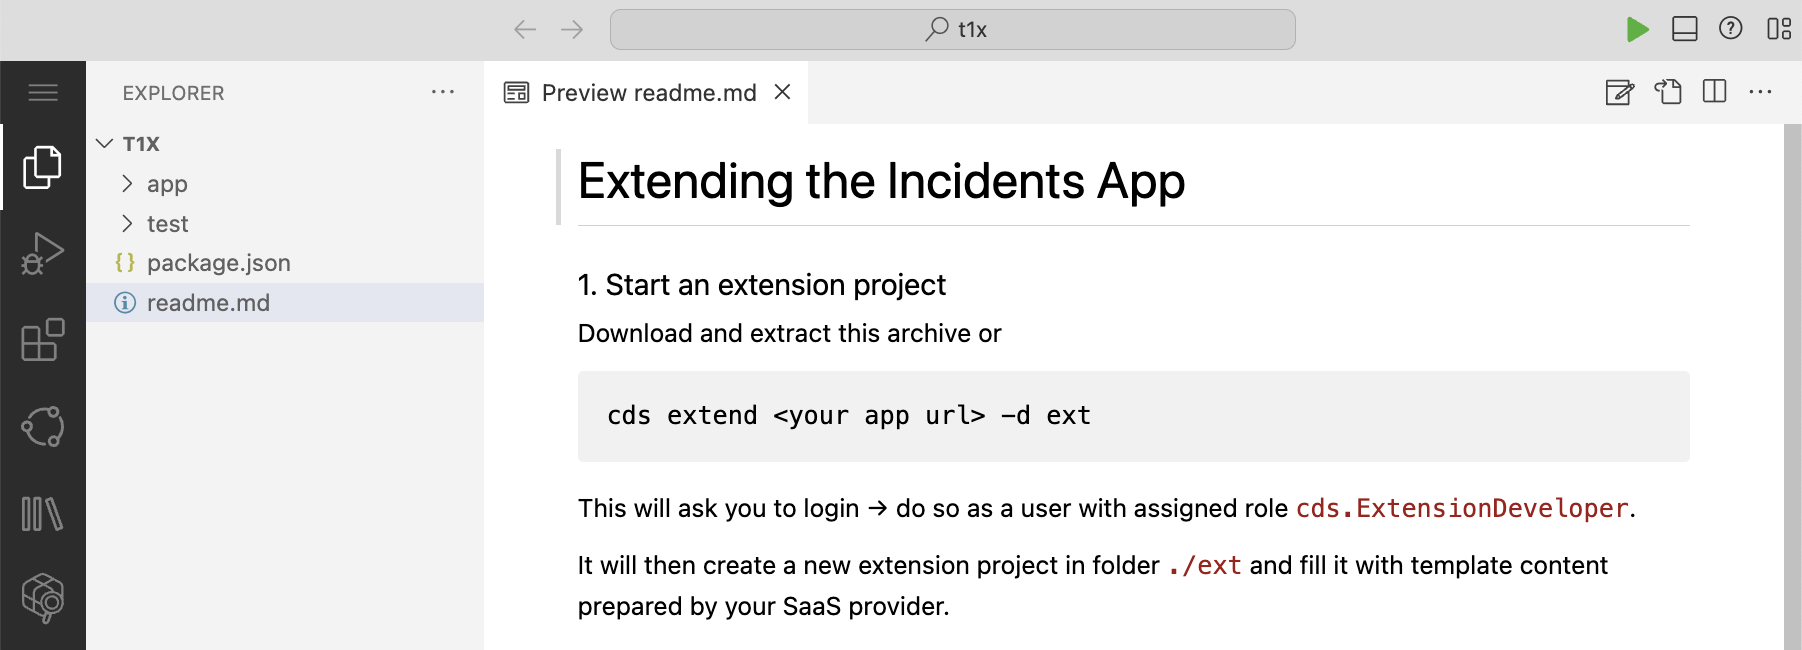
An extension project is essentially a minimalistic CAP project that consists of a package.json file. In our case, the file looks like this:

The package.json file configures the extension's package name, which can be chosen freely. The extends configuration specifies the namespace of the base application's CDS models, which we will learn more about in the next section.
Our template also includes additional files prepared by the provider of the SaaS application, which serve as starting points for actual extensions. We will explore these files further in the upcoming sections.
We need to pull the model to ensure we have the latest CDS model of the base application and benefit from tooling support for creating extensions (such as code completion and error highlighting). Follow these steps:
- Open a Terminal.
- Copy and paste the following command and run it:
cds pull --from http://localhost:4005 -u bobThis command will automatically pull the model from the test tenant t1-ext since bob is assigned to that tenant.
- When prompted for a password, press Enter without any input.
The base model will be downloaded and stored into ./node_modules/@capire/incidents/index.csn, corresponding to the extends configuration in our package.json.
Now we proceed with specifying the extension by adding additional fields to the Incidents entity to capture specific properties of solar panel installations. Follow these steps:
-
Open file
app/extensions.cds. The provided template looks like this:using { sap.capire.incmgt.Incidents } from '@capire/incidents'; /** Template for adding extension fields to incidents... */ extend Incidents with { ext_field1 : String @title: '...'; ext_field2 : String @title: '...' enum { value1 @title: '...' @description: '...'; value2 @title: '...' @description: '...'; }; }
-
Replace the
extendsection with the following code:using { sap.capire.incmgt.Incidents } from '@capire/incidents'; extend Incidents with { component : String @title: 'Component'; orientation : String @title: 'Panel Orientation'; weather : String @title: 'Weather Conditions'; output : Decimal @title: 'Panels'' Power Output'; battery : Decimal @title: 'Battery Fill Level'; };
-
Verify that there are no red underlines in your editor and that no errors are reported. It should look similar to this:
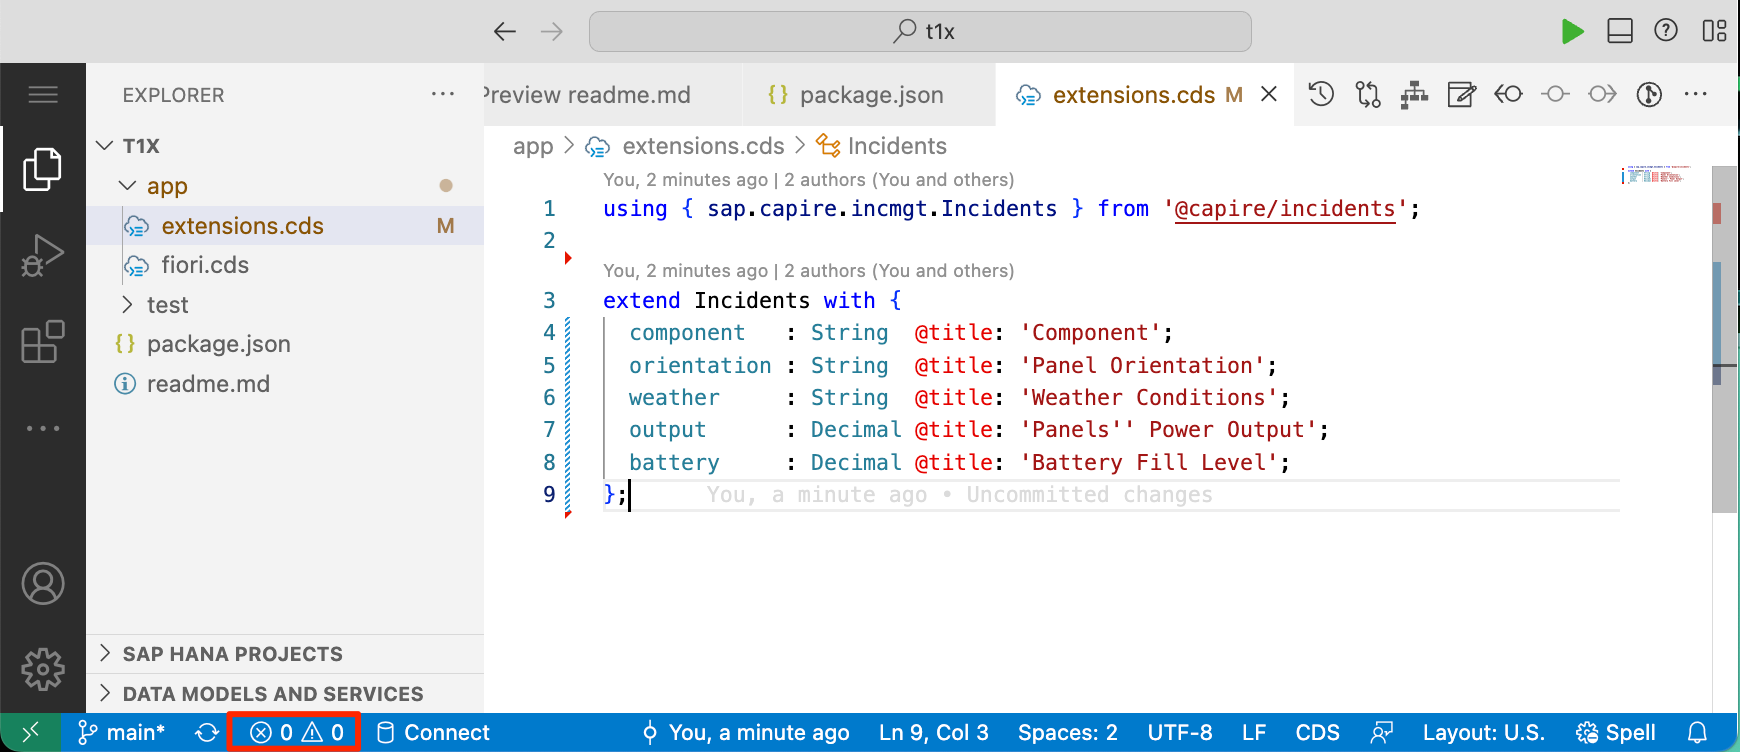
Now that we have added the fields to our domain model, we need to ensure they appear in our UI. To achieve this, we extend the respective Fiori annotations as follows:
-
Open file
app/fiori.cds. The provided template looks like this:// // Extensions for Fiori UIs // using { IncidentsService } from './extensions'; /** Add your ext fields to list pages */ annotate IncidentsService.Incidents with @( UI.LineItem: [ ... up to { Value: urgency }, //> new columns go after this one { Value: ext_field1 }, { Value: ext_field2 }, ... //> rest of pre-defined columns go here ], ); /** Add your ext fields to details pages */ annotate IncidentsService.Incidents with @( UI.Facets: [ ... up to { ID: 'OverviewFacet' }, //> we want a new facet after this pre-defined one { Label: 'System Details', $Type: 'UI.ReferenceFacet', Target: '@UI.FieldGroup#SystemDetails' }, ... //> rest of pre-defined facets go here ], UI.FieldGroup#SystemDetails: { Data: [ { Value : ext_field1 }, { Value : ext_field2 }, ] } );
-
Add the
componentfield to the Incidents list page by replacing the two placeholders (ext_field1andext_field2) lines within theUI.LineItemsection like that:// Add your ext fields to list pages annotate IncidentsService.Incidents with @( UI.LineItem: [ ... up to { Value: urgency }, //> new columns go after this one { Value: component }, //> our new column ... //> rest of pre-defined columns go here ], );
-
Add all new fields in a new section System Details to the Incidents details pages by replacing the contents of the
Dataarray within theUI.FieldGroup #SystemDetailssection as follows:// Add your ext fields to details pages annotate IncidentsService.Incidents with @( UI.Facets: [ ... up to { ID: 'OverviewFacet' }, { Label: 'System Details', $Type: 'UI.ReferenceFacet', Target: '@UI.FieldGroup#SystemDetails' }, ... //> rest of pre-defined facets go here ], UI.FieldGroup#SystemDetails: { // our new section Data: [ { Value : component }, { Value : orientation }, { Value : output }, { Value : battery }, { Value : weather }, ] } );
Start the server by running the following command in the Terminal:
cds watch --port 4006The server will start and the output will be displayed in the Terminal, as shown below:
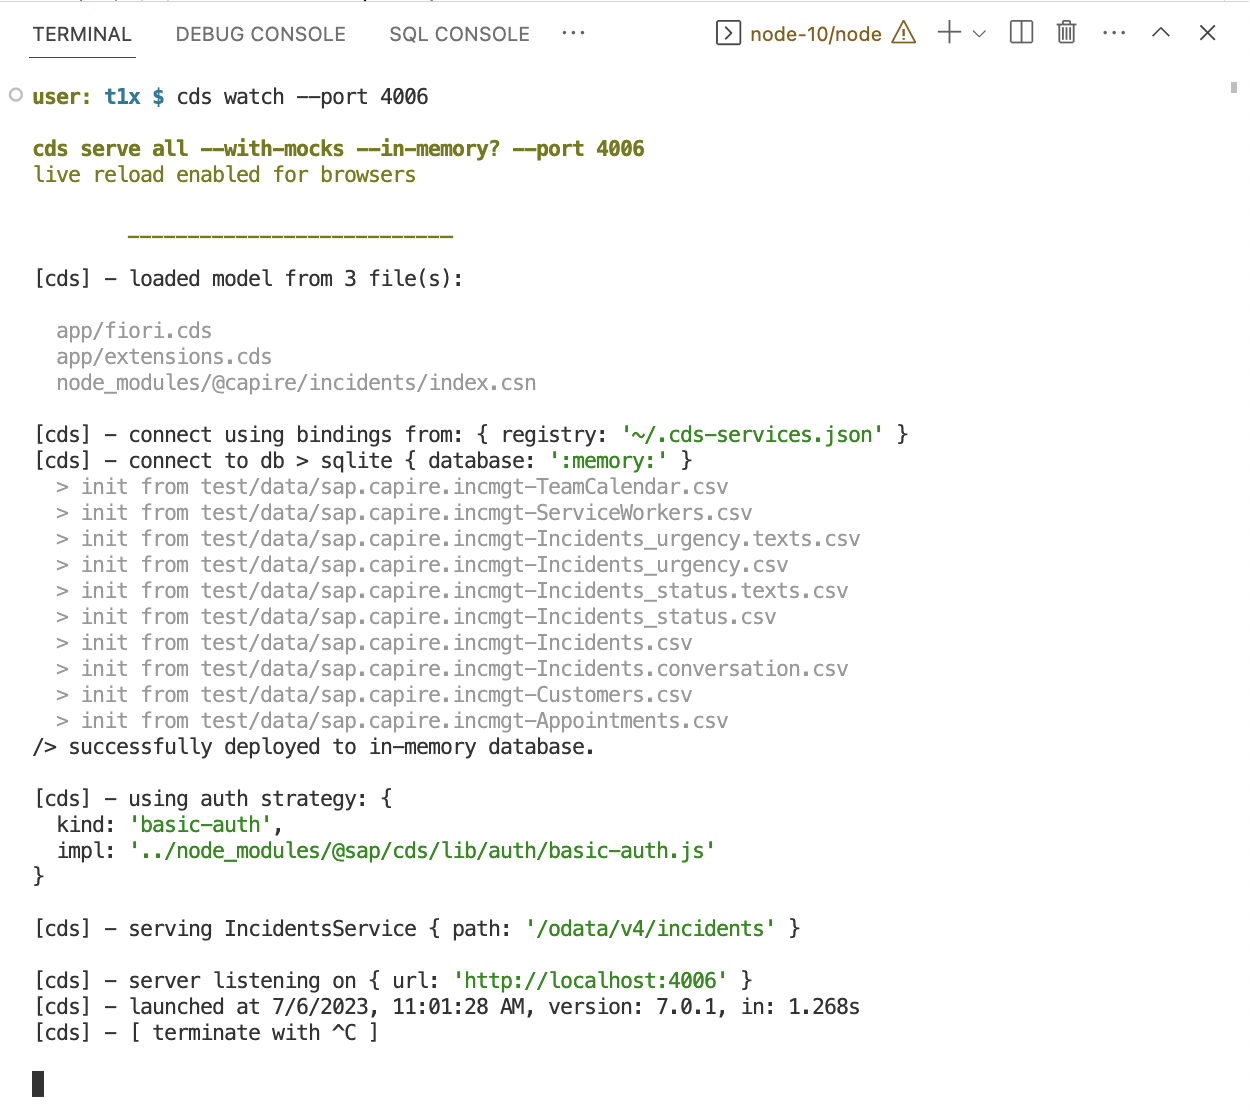
👉 Note: In this hands-on, we run the server on port 4006 to avoid conflicts with the actual incidents app running in parallel on ports 4004, 4005. In a real extension project, you would be independent of the base project and would not require this step.
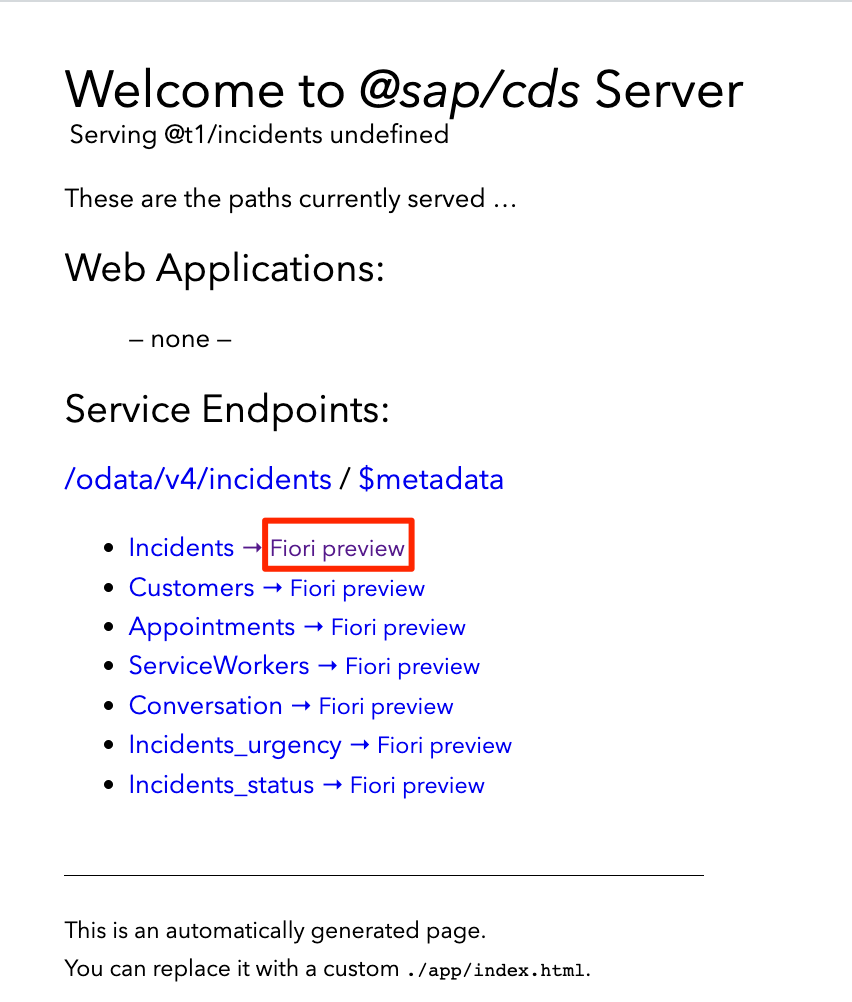
- Open the Fiori UI by clicking on the [ Open in New Tab ] button in the toaster showing up (or Cmd/Ctrl-click on the server URL in the trace output), as explained in exercise 1. In response to that, you should now see CAP's default index page, as shown below:
-
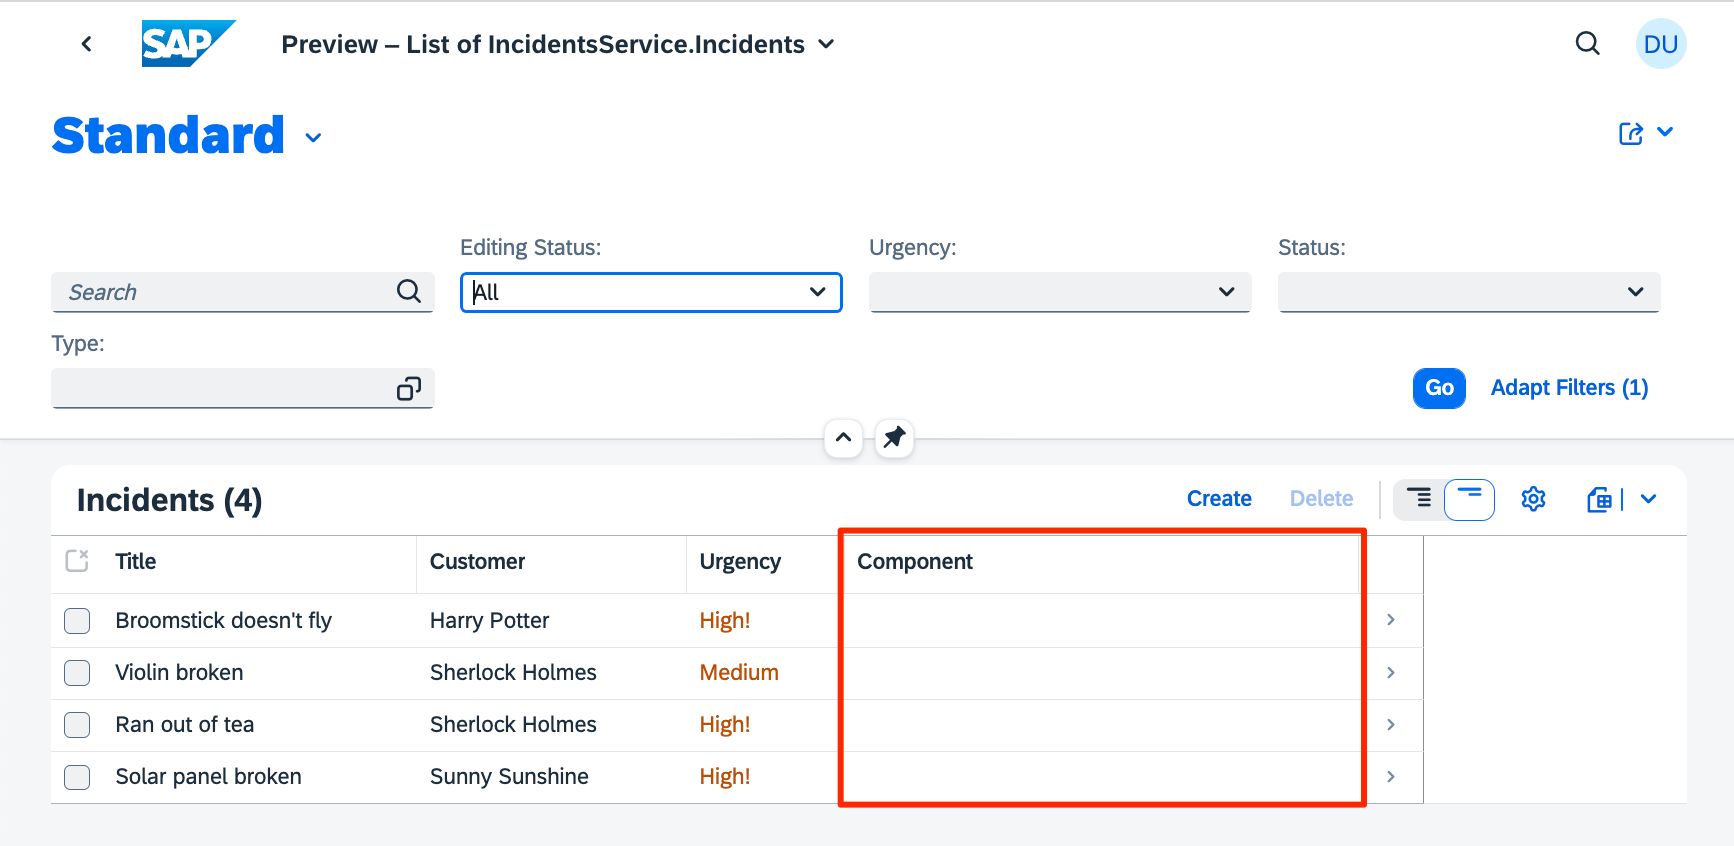
Click on the first Fiori preview link highlighted above. This will take you to the Incidents list, which now includes the newly added column Component as in the screenshot below:
-
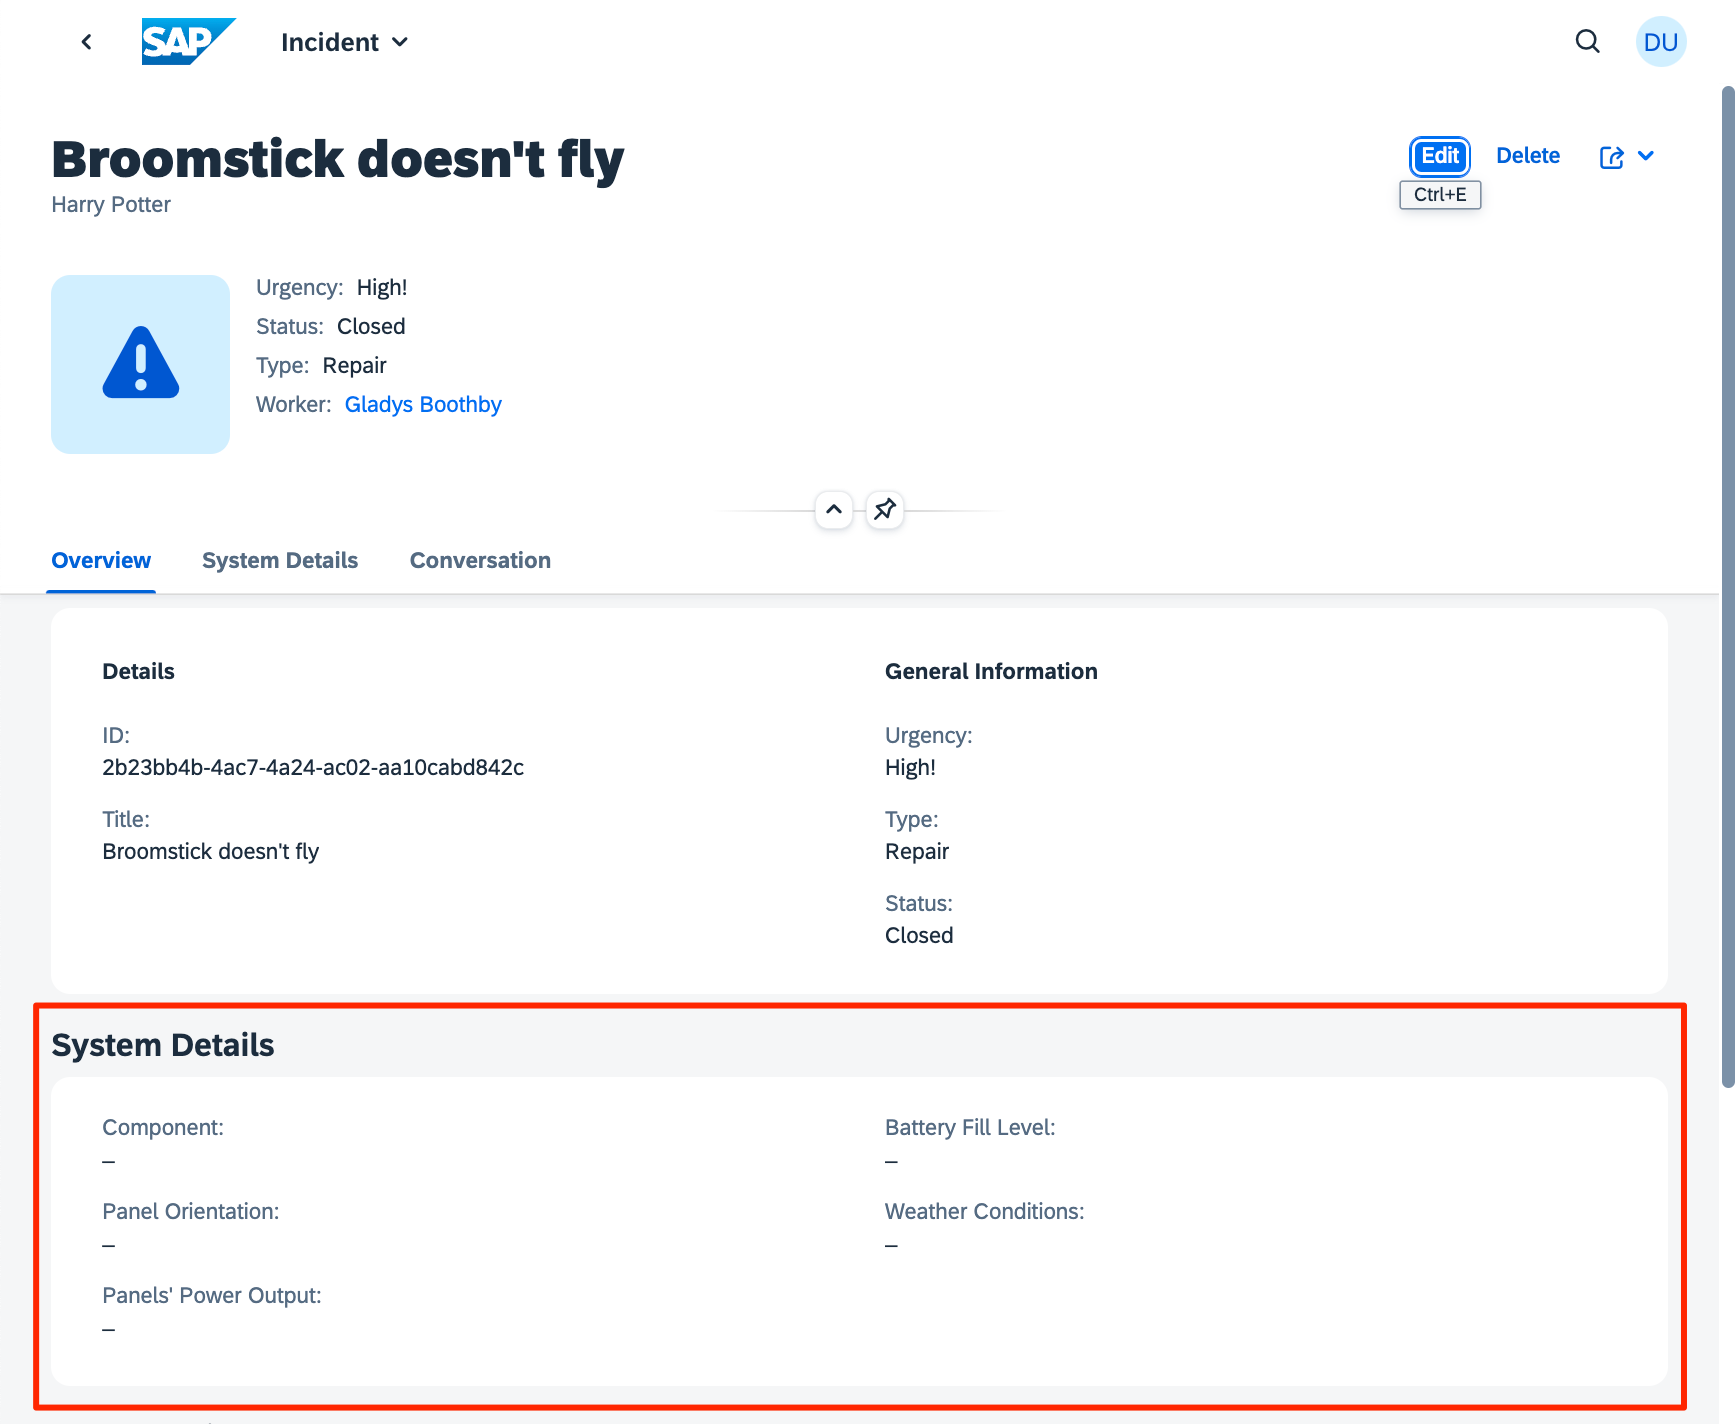
Next click on the first row to view the details page for that incident. You will see the new section System Details with all the added columns, as shown below:
-
Feel free to [ Edit ] the data, enter some values, [ Save ] your changes, and observe the updated information displayed on the details page. You can navigate back to the list page and verify that the entered values appear in the Component column of the first row.
Note: Since we are working on an extension project only, the extended application will start as an incomplete look-alike of the real incidents app without any custom logic active. However, the provider of the incidents application has included some test data with the extension project template, so you will immediately see some data in the UI. The test data is available as .csv files in the ./test/data folder.
After performing the initial check, we are now ready to test the extension in the real environment using our test tenant. Follow the steps below:
-
Switch back to the
t1xproject and open a new Terminal. Make sure you select thebashTerminal, not the one running the server. Create a new Terminal if there is no such option besides the server Terminal.
-
Build the extension using the following command:
cds build
The log output will indicate that the following files have been generated:
```sh
[cds] - done > wrote output to:
   gen/ext/extension.csn
   gen/ext/package.json
   gen/extension.tgz
```
The first two are the generated model in .csn format and your package.json. The last file is a packed archive containing everything.
-
Activate the extension by pushing the archive to the server using the following command:
cds push --to http://localhost:4005 -u bob
Note: This will deploy to the test tenant t1-ext since bob is assigned to that tenant.
-
When prompted for password, simply just press Enter without any input. You should see an output similar to the following:
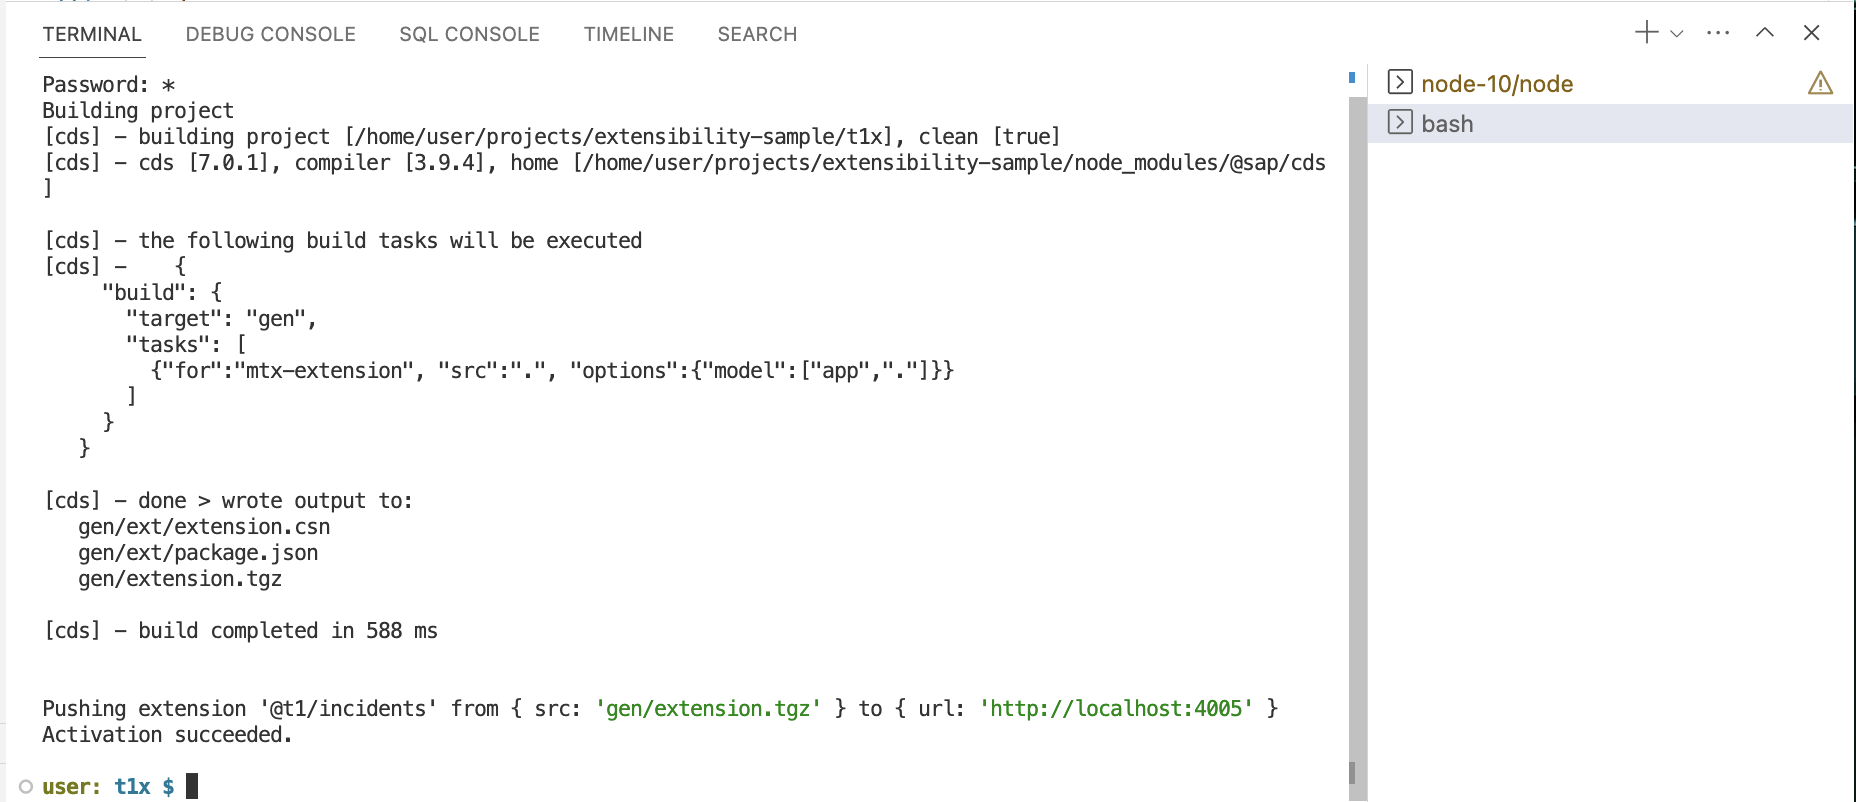
Upon receiving the pushed extension, the CAP runtime will automatically perform the following actions:
* Validate the extension
* Dynamically extend the loaded model for the `t1-ext` tenant
* Re-deploy the extended model to the database, adding the new fields
* Refresh all bootstrapped services to serve the extended model
* Store the extension definitions in a system table
* Re-apply the extensions after each upgrade of the base application
-
Test the UI again, but this time with the real deployed app for test tenant
t1-ext:-
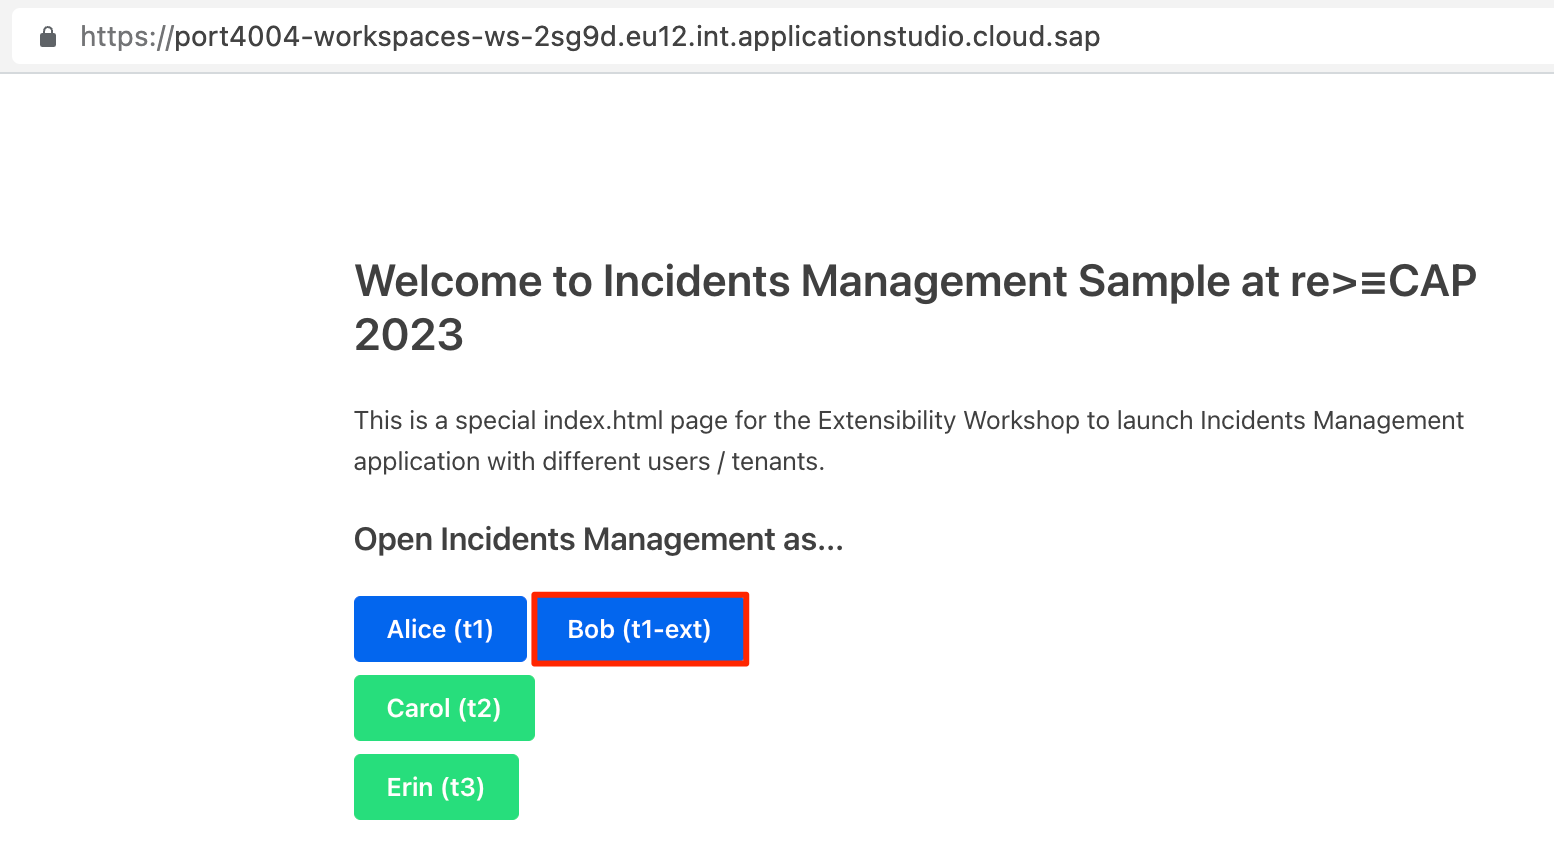
Switch back to the LaunchPad for AD264 browser tab:
-
Click on button [ Bob (t1-ex) ]
-
Incidents list page should appear, including the newly added Components column.
-
Continue testing the UI as you did before with the server running locally. Follow the instructions in the previous section.
-
Once all the previous steps have been successfully executed and the necessary approvals from responsive administrators have been obtained, we can finally activate the extension for all users of the t1 customer/tenant. To do so, we need a user with admin or cds.ExtensionDeveloper privileges for the production tenant, which in our setup is alice.
-
Switch back to the browser tab of our
t1xproject -
In the Terminal run
cds pushcommand again, this time suing thealiceuser instead ofbob:cds push --to http://localhost:4005 -u alice
Note: This will deploy to production tenant t1 since alice is assigned that tenant.
-
Finally, test the UI again as you did before with the server running 'locally', but this time with the real incidents application instead of the mock version, and using the production tenant.
-
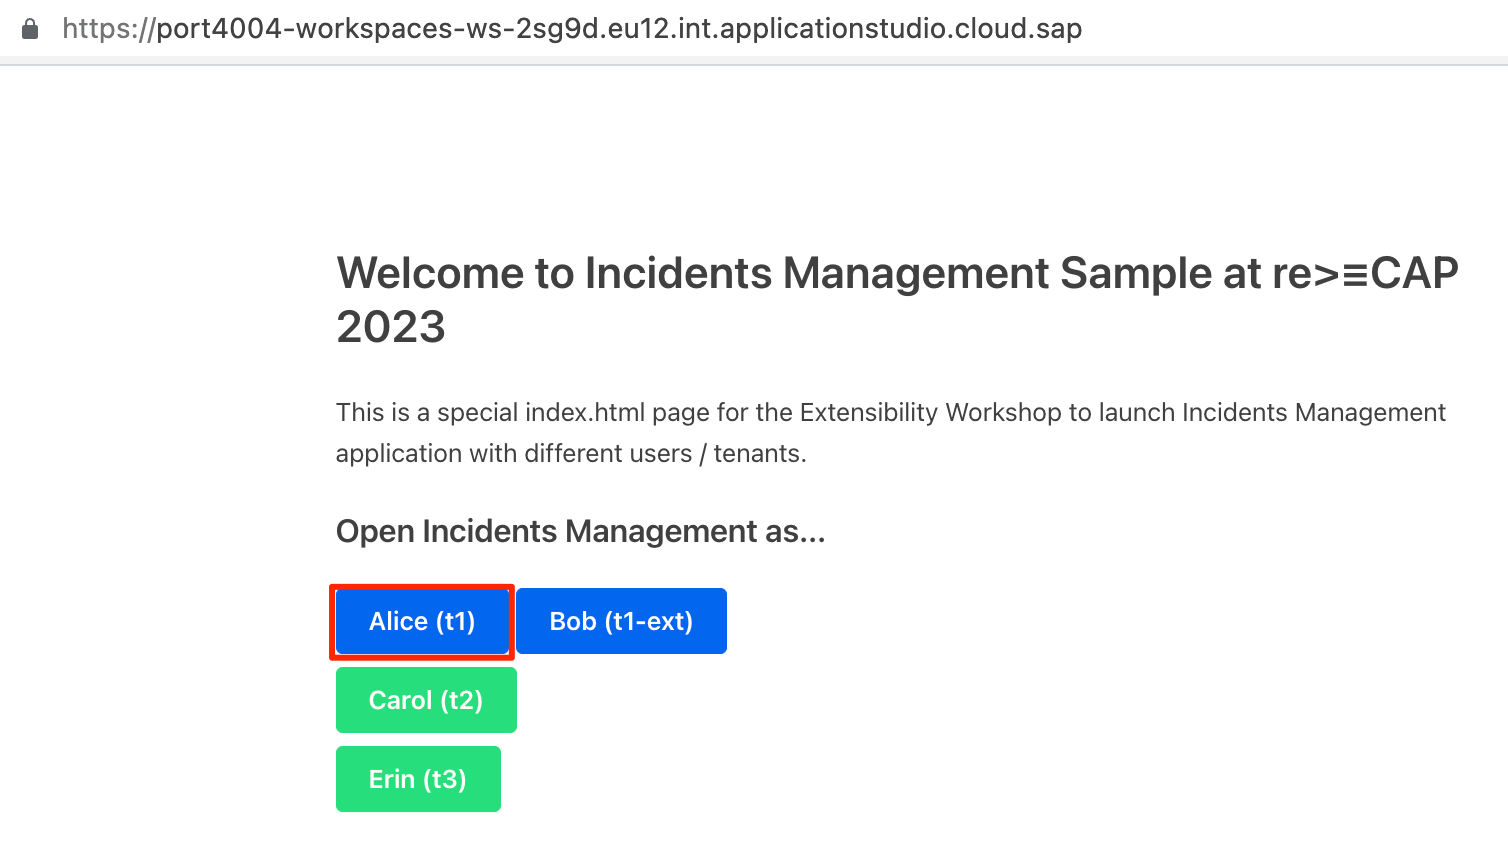
Go back to the Launchpad for AD264 browser tab
-
Click the [ Alice (t1) ] button .
-
The Incidents list page should appear, including the newly added Components column.
-
Continue testing the UI as you did before with the server running locally. Follow the instructions in the previous section.
-
In Bob's shoes, we have successfully added solar panel system-specific extension fields to the incidents objects, customizing the base incidents management SaaS application to meet the specific needs of customer 1.
CAP Spotlights:
- CDS as Ubiquitous Modelling Language — already in exercise 1 when we built the base application, and also in this exercise, when we added extensions, all we do is captured in CDS. Domain modelling, service definitions, UI definitions via Fiori annotations, adding extension fields and extending UIs correspondingly.
-
CDS Aspects for Extensibility — all CDS definitions are intrinsically extensible, using the keywords
extendorannotatewe can add new fields, new relationships (associations and compositions), new annotations or override annotations. And as everything is expressed in CDS, we can apply this same technique to extend everything.
In the next exercise 4 — Pre-built Extensions we will show how to share and reuse such extensions, for example as a partner providing pre-built industry-specific verticalizations to given SaaS applications.