Long term statistics support #81
Replies: 9 comments 34 replies
-
|
thanks @FrnchFrgg and @dbuezas ! How do I install this beta version next to the normal version? |
Beta Was this translation helpful? Give feedback.
-
|
It's quick and simple, see here: |
Beta Was this translation helpful? Give feedback.
-
|
Out of beta in the next 5 minutes |
Beta Was this translation helpful? Give feedback.
-
|
Hi, thanks for the good work. I wanted this feature since the first version. |
Beta Was this translation helpful? Give feedback.
-
|
I exaggerated the effect a lot so it is visible (set the resolution to a minimum of 25 datapoints in screen) |

Beta Was this translation helpful? Give feedback.
-
|
And here is with a minimum of 500 datapoints. The difference between hour and day is because I'm plotting temperatures (which obviously have a cycle of exactly 1 day). |

Beta Was this translation helpful? Give feedback.
-
|
Experimental branch: |
Beta Was this translation helpful? Give feedback.
-
|
Is the behavior of |
Beta Was this translation helpful? Give feedback.
-
|
Yes, in the readme https://github.com/dbuezas/lovelace-plotly-graph-card?tab=readme-ov-file#automatic-period |
Beta Was this translation helpful? Give feedback.
-
|
Here is a gorgeous example from @r-jean-pierre |

Beta Was this translation helpful? Give feedback.
-
|
Here is where I am so far cards:
- type: custom:plotly-graph # Kid's room
defaults: &mon_defaults
entity:
texttemplate: "%{y:.1f}"
connectgaps: false
hovertemplate: ''
line:
shape: spline
width: 2
entities:
- entity: sensor.ths_kids_temperature
name: T[°C] (max)
line:
color: rgba(81, 117, 159, 0.4)
width: 1
statistic: max
period: 1day
showlegend: false
show_value: false
- entity: sensor.ths_kids_temperature
name: T[°C] (min)
fill: tonexty
fillcolor : rgba(81, 117, 159, 0.2)
line:
color: rgba(81, 117, 159, 0.4)
width: 1
statistic: min
period: 1day
showlegend: false
show_value: false
- entity: sensor.ths_kids_temperature
texttemplate: "%{y:.1f}°C"
name: T[°C] (mean)
line:
color: rgba(81, 117, 159, 1.0)
statistic: mean
period: 4hour
show_value: true
- entity: sensor.ths_kids_humidity
name: φ[%] (max)
line:
color: rgba(143, 86, 164, 0.4)
width: 1
statistic: max
period: 1day
showlegend: false
show_value: false
- entity: sensor.ths_kids_humidity
name: φ[%] (min)
fill: tonexty
fillcolor : rgba(143, 86, 164, 0.2)
line:
color: rgba(143, 86, 164, 0.4)
width: 1
statistic: min
period: 1day
showlegend: false
show_value: false
- entity: sensor.ths_kids_humidity
texttemplate: "%{y:.1f}%"
name: φ[%] (mean)
line:
color: rgba(143, 86, 164, 1.0)
statistic: mean
period: 4hour
show_value: true
layout: &mon_layout
hovermode: "x unified"
yaxis:
range:
- 10
- 40
gridcolor: rgba(233, 233, 233, 0.4)
zeroline: false
showticklabels: true
tickfont:
color: rgba(81, 117, 159, 1.0)
title: false
yaxis2:
range:
- 40
- 90
gridcolor: rgba(233, 233, 233, 0.4)
zeroline: false
tickfont:
color: rgba(143, 86, 164, 1.0)
title: false
margin:
"l": 32
"r": 32
"t": 64
"b": 40
xaxis:
gridcolor: rgba(233, 233, 233, 0.4)
rangeselector:
"y": 1.12
"x": 0.72
buttons:
- count: 12
step: hour
- count: 5
step: day
- count: 30
step: day
hours_to_show: 72
refresh_interval: 30
title: Kid's room |
Beta Was this translation helpful? Give feedback.
-
|
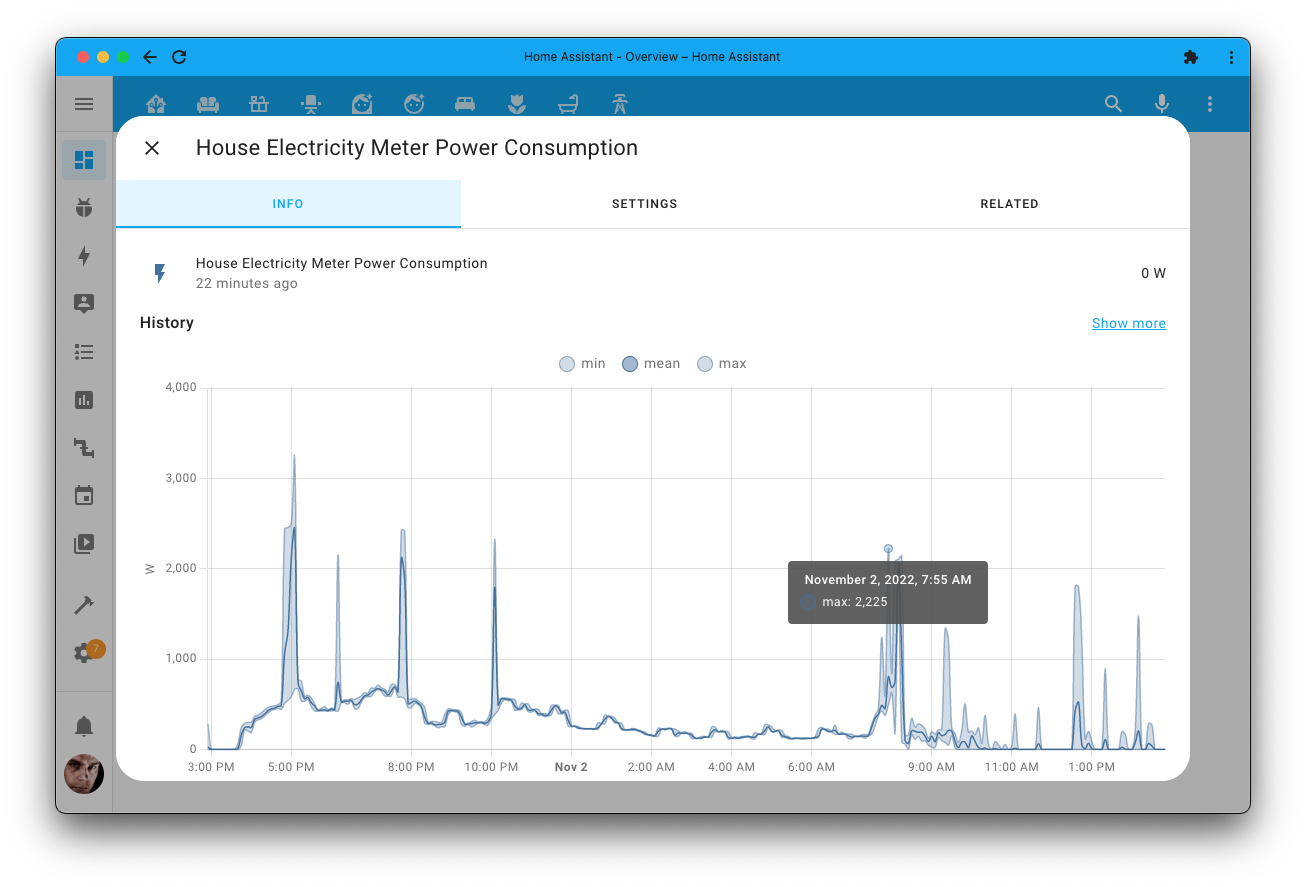
Did you see this? https://www.home-assistant.io/images/blog/2022-11/long-term-stats-more-info-dialog.png |
Beta Was this translation helpful? Give feedback.
-
|
I saw it too, I'm on an early beta, since I saw the water usage metering and the LTS/week support. Both are something I wanted. |
Beta Was this translation helpful? Give feedback.
-
|
@r-jean-pierre , I am unable to use
Do I need to define custom periods somewhere else? |
Beta Was this translation helpful? Give feedback.
-
|
Were those added in home assistant's statistics API? |
Beta Was this translation helpful? Give feedback.
-
|
I think it's the 5 periods we can select with the combination statistic/period: and true that it's not possible to tweak it Now I look at my own example, it shouldn't work, and currently this is not what I have in my running Yaml. I don't remember why it did it, more powerful or had technical issue (?)... |


Beta Was this translation helpful? Give feedback.
-
|
thanks. I don't fully understand the new syntax: is this dynamic depending on the time windows displayed on the chart? And secondly, what does "0s" mean in this case? |
Beta Was this translation helpful? Give feedback.
-
|
The left side is the minimum visible range, see readme |
Beta Was this translation helpful? Give feedback.
-
|
Hi! I'm posting here cause the title makes sense ("Long term statistics support") I have a simple and easy graph with 5mins average
If you look on bottom left corner (red), I tried to display 2 weeks, but data history length seems to stop ~10 days ago I just noticed "recently", when I was forced to restore a backup to restart my HA setup and therefore lost some of my history (it was two months ago) It seems to have the same behaviour without Is there something I missed (or misuse) ? |

Beta Was this translation helpful? Give feedback.
-
|
Hehe. Using plotly in a notebook? |
Beta Was this translation helpful? Give feedback.
-
|
Of course ! +seaborn when I don't need interactivity. Finally, my issue is not the graph rendering library-ies, but data preparation... Python+pandas come to the rescue there. And I would say even much most straightforward: using functions! and constants! My YAMLs are ugly. A real HA-ninja-expert would probably say "it's possible", but out-of the-box, with only 5 neurons: it's impossible!!! Last but not least: even with custom:layout-card from thomasloven, I'm still struggling in some situations with my card layout, border, margin, padding etc. and sometimes have to give up on tasks because they seem impossible to accomplish |
Beta Was this translation helpful? Give feedback.
-
|
It would be nuts if there was a jupyter notebook card |
Beta Was this translation helpful? Give feedback.
-
|
Yes indeed, and talking about data+maths (because I always focus on pixels with plotly!), I have a question/doubt: Assuming I want to use There is something that I don't get and looks shifted of almost 2H:
Top sensor is not aggregated, I already got data after 17:00, if mean that from 16:00 to 17:00 we can compute something, but the earliest aggregated data is at 15:00 (Bottom graph is min/max/mean per hour of the same sensor) But why there is this shift in time? Computation is probably right, but it occurs too late Last but not least, as a challenge, have you ever consider to compute and display the last "unfinished" bloc of 1H? I mean, assuming it's 15:20, why not computing avg over 15:00 to 15:20 and display the current avg at time 15:20. Of course it makes more sense and more useful at 15:59!!! Could be a great option as there is no risk with |

Beta Was this translation helpful? Give feedback.
-
|
I think home assistant does what you mention: at the end of the period, compute stats from last period (e.g 1h) & store them. And whatever HA stores in the db, this card plots. To compute the unfinished part you may find this discussion interesting |
Beta Was this translation helpful? Give feedback.
-
|
Hello, I have a question that may be fits here. |

Beta Was this translation helpful? Give feedback.
-
Thanks to @FrnchFrgg , this version brings support for statistics!
This means that multi day plots can now be very snappy, and you can look way back in the past too.
After we added statistics support, I decided to make a fairly big refactor to improve the API of both statistics and attributes.
Because of that, this one is marked as beta version. Please feel encouraged to report any bugs as issues, or drop a thanks to @FrnchFrgg in the discussions section if you were missing the feature!
This discussion was created from the release Long term statistics support.
Beta Was this translation helpful? Give feedback.
All reactions