 Apache Flink monitoring support is now available in the open source OpenTelemetry collector.
 In this article, I’ll show you a simplified way to configure a critical open-source component, Zookeeper.
 I’m a ChartMogul customer, and I’m a bootstrapper. I’m the founder of Feature Upvote, a bootstrapped and profitable SaaS.
 What are the most important KPIs for startups to measure success? Find your answer in this article and learn what key product metrics to track to enable growth.
 To succeed at sales, you need to know the value of your product.
 If you're looking to increase your website's metrics, growth marketing is the process for you.
 Learn how to approach data-driven measurement properly. See what unexpected results we got in a bank and get insights for your own data analytics journey.
 Which application metrics should you collect for your microservices?
 One thing that surprises me over and over is how many startup founders don’t use models and equations in their business. I always get strange looks when invariably I ask my favorite business questions: “So, what is the equation here? What variable are you hoping to affect by doing this?”
 Imagine the situation, you have a legacy system partially migrated to multiple services and used by the relatively small amount of concurrent users. And one day stakeholders want to create an open API and expose the system to external clients with the load significantly higher than the existing system can handle, and it should be scalable to handle in the future even more.
 Imagine you are in the process of migration of a legacy system from the data center to the cloud to make the system scalable. If containerization is not an option you will try cloud-native autoscaling. One of the most commonly used metric to perform autoscaling is CPU utilisation. If your application does not scale well based on this metric this is pretty likely because of more serious issues. Let's see why.
 Our concepts of Lead Time and Cycle Time came from the field of Operations Management and Production Engineering. As such, I think it’s beneficial to all of us to maintain coherent with them and use the same semantics in Software Engineering Management as well.
 P value is the probability that the results we are seeing are real and not by random chance. P-Hacking is a term used to describe the scientific manipulation of data to get the desired P value. All of us do this with our experiments, consciously or not.
 Software engineering metrics help daily stand-up meetings to be more productive for the team. They can become tedious or irrelevant for many developers when they frequently exceed the fifteen minutes time box or even sound like a work report.
 APIs are the blood vessels of digital business.
 To help soothe the shock of returning to work after the holidays, we've started a new tradition over at Waydev and kick off the year with a good movie or two. Since it had to be something both entertaining and inspiring, we chose to go with a classic: Moneyball, the 2011 film starring Brad Pitt.
 Every significant business result consists of micro-level metrics that one can and should manage daily. Learn how to increase your revenue with small steps.
 The question is not, “Does the company have product/market fit or not?”. The more appropriate question is, “What’s the strength of the company’s product/market fit?”
 The four key DevOps metrics are an exciting set of measurements. They’re getting more and more relevant since the book Accelerate has been published. I firmly believe they’re essential for engineering teams seeking effectiveness and efficiency.
 The podcast industry is booming. Each week the number of Americans who listen to podcasts tops the number of those who have Netflix accounts.
 No matter how big or small your business is, you need to have certain metrics that tell you how much growth it has achieved.
 There has been some debate around the importance of public 'likes' on social media platforms. Let's discuss this further with sociological insights.
 Can product-market fit be measured? And if so, how? What are the most important things to keep an eye on during your journey towards the holy grail of startups?
 In many cases, custom metrics may be useful to make more ad-hoc configuration of autoscaling in AWS. For example, a custom metric can allow an autoscaling group to react more rapidly on spikes or to take into account the health state of hosts for concurrency based metrics. Let's see how to set up a custom metric and autoscaling policy for an autoscaling group with an application load balancer and target group using AWS Console.
 This article provides definitions on what key metrics are, a framework for categorizing them, and recommendations of four basic rules to set useful metrics, using real-life examples.
 Product manager interviews usually include a section on metrics. As a data scientist at Uber, I’ve often given or helped friends prepare for these interviews. The difference between candidates who crush the metric questions and those who struggle turns, as far as I can tell, on whether they have a framework that they can apply.
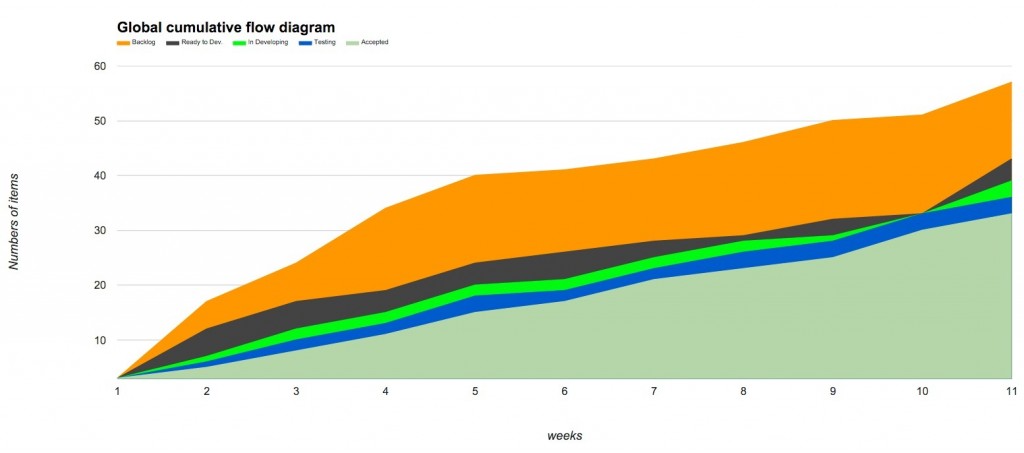 Every conversation I have with CTOs, Engineering Managers, and Tech Leaders eventually gets to the “Which Metrics Should We Measure?” discussion.
 If you have darker skin, shuffle when you walk, or regularly push a stroller, it can throw off the data
 Every time facing a task of configuring how the system should scale out and scale in, we decide what metrics and policies will be more effective. I have already described CPU based policies and what challenges they may have. But what if this is not an option, i.e. the service is represented by legacy application, written years ago, not well documented, etc. and we still want to run it in Cloud and autoscale?
 Running any application in production assumes reliable monitoring to be in place and serverless applications are no exception.
 Monitoring is a crucial part of observability. Learn how monitoring can specifically improve security, performance, and reliability.
 Venture capitalists get pitched hundreds of times a year. And, even though countless articles have been written on the topic of how to present a startup to professional investors, entrepreneurs consistently fail to address check points needed by the investor to come to a decision.
 In this post, we will dig into the Google HEART framework: a simple way to ensure you take into consideration every aspect of the user journey.
 A lot of the work we do at ChartMogul centers around how we display and present your data in a clear and transparent way.
 In the Atlassian playbook, it states that Sprint Retrospective’s goal is to identify how to improve teamwork by reflecting on what worked, what didn’t, and why. Usually, the meeting consists of brainstorming what the team did well and what the team needs to do better.
 Ah, business metrics… To me, it’s the best illustration of how information overload can do more harm than good. A brief online search will provide you with dozens of “key, important, essential business metrics that every company should know”.
 Facebook AI researchers have leveraged advancing technologies and Machine Learning to develop a system with a level of intelligence on par with humans. AI enables and equips Facebook with various tools, including interactive chat modules, chatbots, polls, surveys, and more.
 Engineering managers are in charge of tech teams. It means there are tens or maybe hundreds of people supporting them. Generally, they need to ensure the best practices around software development, hire and train engineering staff, align and motivate the team towards the company’s goal, manage the team’s performance, and be accountable for all technical decisions.
 This post was written by Dean Record, Engineer at Goji Investments.
 The metrics we choose can expose problems. But it can also hide them behind irrelevant data.
 Tradeoff between speed and quality is a myth.
 Ever wondered what key metrics other engineering teams are tracking?
The short answer: it varies completely. Even within the same organization, different teams
 Whether you’re serving your colleagues with an internal company app or you’re dreaming of topping the charts, some would say the hard work is only just about to start. No matter how much testing and research you’ve done, nothing compares to real world usage.
 In my previous article, I talked about the importance of logs and the differences between structured and unstructured logging. Logs are easy to integrate into your application and provide the ability to represent any type of data in the form of strings.
 Engineering managers often rely on subjective clues to assess how their team is doing. But decisions made based on gut feel and imperfect measurements are less than ideal — sometimes they result in team success; other times they result in disappointment.
 Becoming a manager is usually one of the biggest challenges of an engineer’s career. We are usually used to algorithms and state machines, which are predictable and have specific outputs depending on the input.
 How do you measure quality in software engineering? I guess this is the question there will always be a debate on. There are so many approaches to this question that finding only one answer is just impossible. In this article, we will be listing the quality-related metrics that the top engineering teams have been keeping track of, and see when and how you should use them.
 If you can’t answer it, don’t worry, you’re not alone. Many engineering leaders couldn’t tell you without some significant number-crunching. Gaining visibility into performance is only half the battle though. Knowing how to interpret metrics and how to apply them to improving performance is where the magic happens. Many CEOs do not know how to align engineering metrics to business KPIs (revenue, customer retention, etc.). Bringing metrics to your board or non-technical CEO for the first time may be challenging if you are unable to help them bridge the gap.
 On average, a software development team reworks about 26% of its code prior to release. Even after accounting for necessary changes, those wasted hours can cost a medium-sized business upwards of $4.7M a year.
Still, when engineering leaders look to cut costs, they often look at departmental spending. Software licenses, discretionary expenses, and even salaries may come under scrutiny.
But not all costs come with such a clear price tag — inefficiencies in the software development process are harder to quantify, but much more expensive.
According to a 2017 DORA white paper, Forecasting the Value of DevOps Transformations, the cost of Rework in software development is staggering, setting businesses of all sizes back millions of dollars a year.
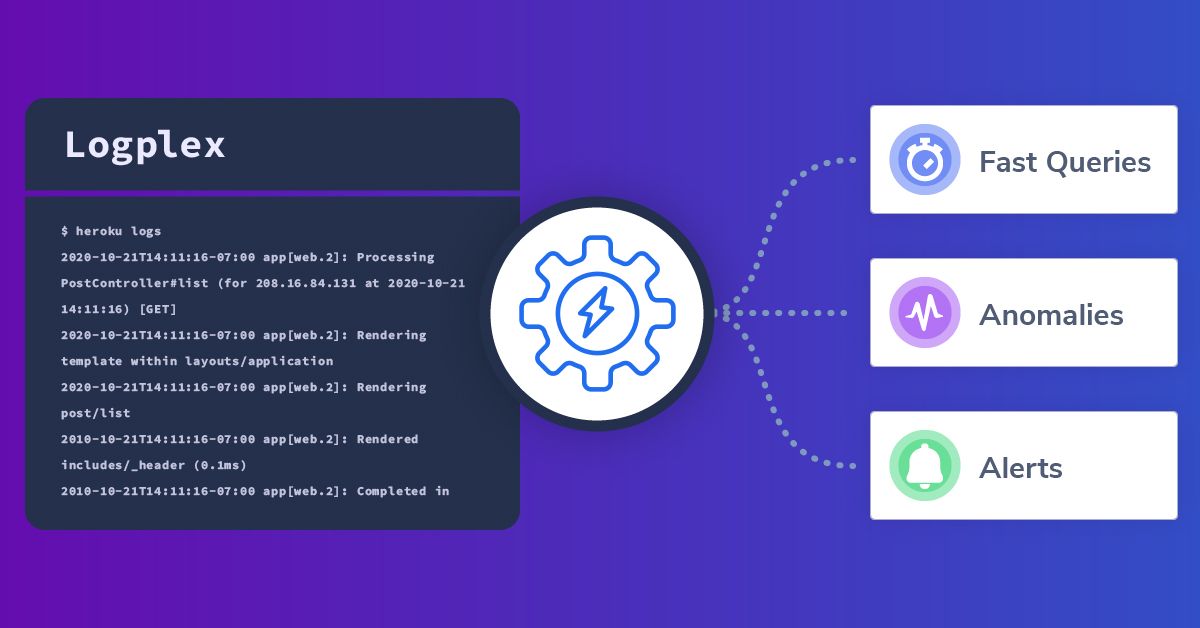
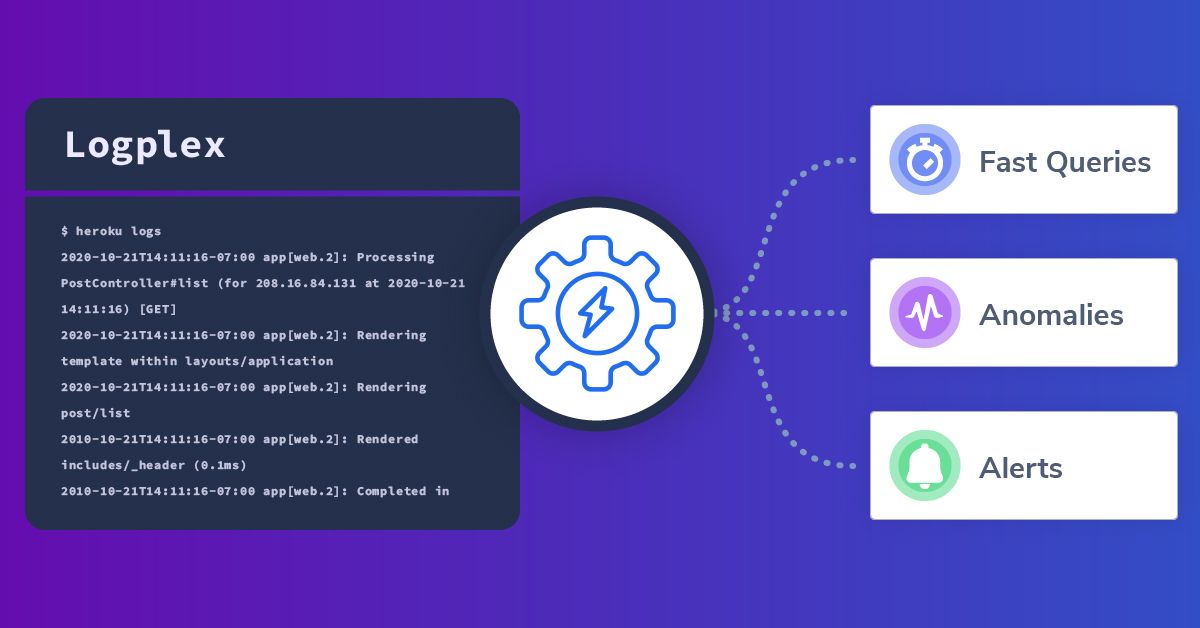 Heroku differentiates itself from other cloud providers, by offering a complete, cohesive environment. Where AWS and GCP present a decoupled toolkit, Heroku strives for a seamless, UI-driven experience for the user. This philosophy is clearly embodied in its metrics functionality, which is often a single click or basic configuration file away.
 How to Use - and NOT Abuse - Software Engineering Metrics
 We will focus on MSE and MAE metrics, which are frequently used model evaluation metrics in regression models.
 A common architectural design pattern these days is to break up an application monolith into smaller microservices. Each microservice is then responsible for a specific aspect or feature of your app. For example, one microservice might be responsible for serving external API requests, while another might handle data fetching for your frontend.
 Introduction
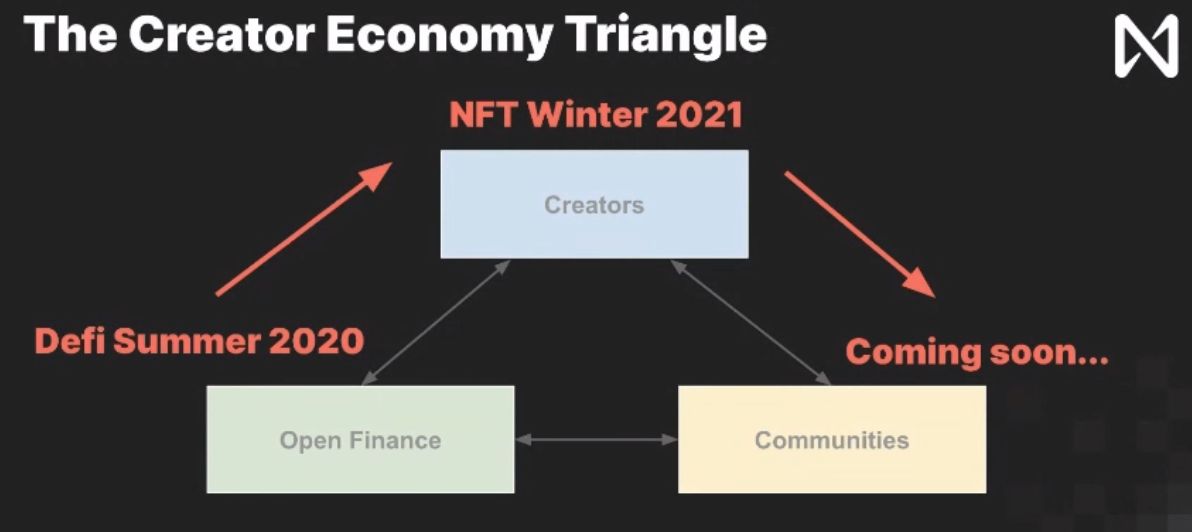
 Consensus 2021 panel discussions around crypto states in Latin America and layer one and layer two blockchain protocols. Tokenomics metrics and usage growth.


