Starter repo for collaboration problem set. You should have one repository for your team -- make sure to add all team members as collaborators to the project.
Almost all data-driven research projects involve multiple team members working on the same code-base. In fact, they often involve people working on the same documents at the same time, and running the same code on different computers.
The purpose of this assignment is to give you opportunity to practice this kind of collaboration. Something will likely go wrong, which is really the point. Following this assignment, you'll be prepared to dive into your final project alongside your other team members.
You have probably seen US election visualization, both at state level

and at county level
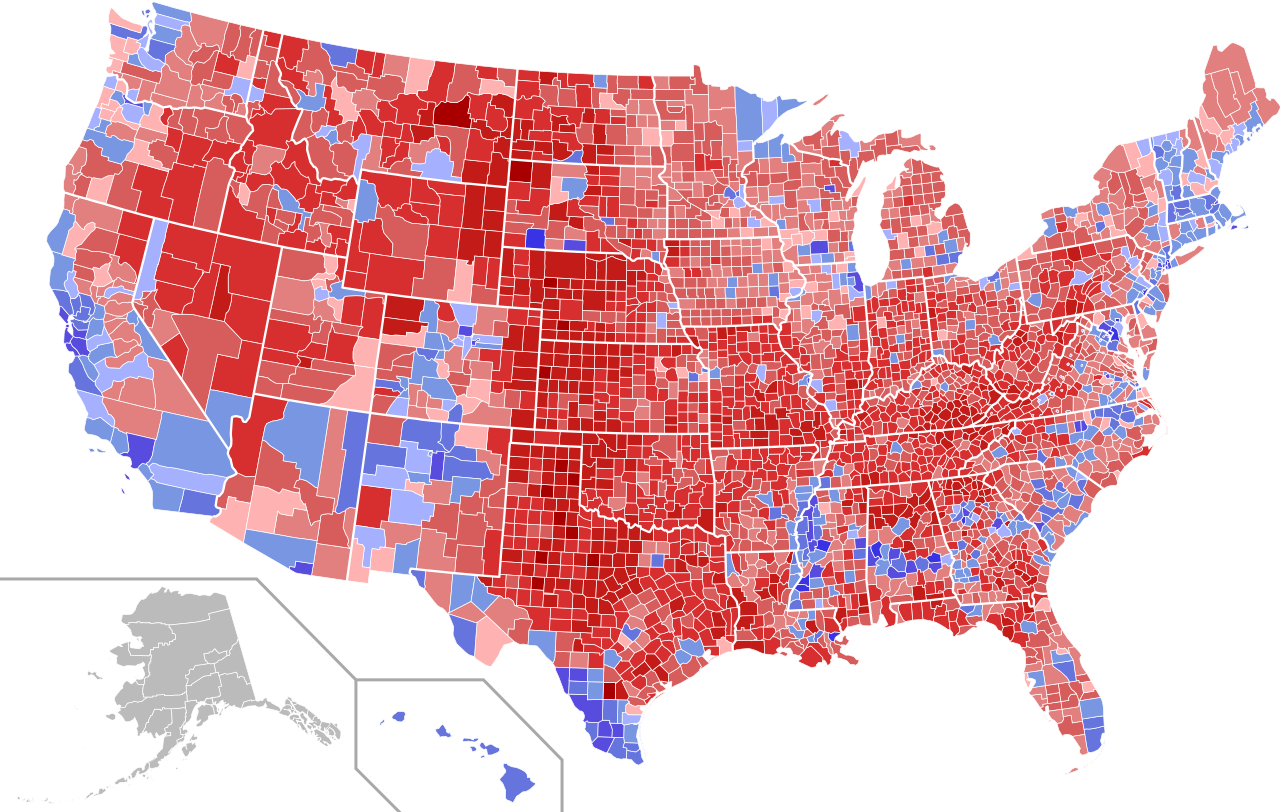
Your task here is to analyze the few past elections and come up with your own visualizations and other analyses. The dataset us-presidential-elections_2000-2016-wide.csv.bz2 is on canvas. Data for 2000-2015 are downloaded from Tony McGovern's repo on GitHub and merged with census fips codes, and census data for income, population and land area. Data for 2020 elections comes from github.
The dataset contains the following variables:
- FIPS: county fips code
- year: election year
- state: state name
- state2: 2-letter state code
- region: census region (west, midwest, south, northeast)
- county: county name
- office: President (we look only at presidential elections)
- totalvotes: total number of votes cast in this county-year
- income: personal income, USD/per capita (BEA data)
- population: population, census estimate (BEA data)
- LND010200D: land area (sq.mi) at 2000 (Census data)
In addition, there are two sets of variables separately for democrats and republicans:
- candidate: name of the candidate
- candidatevotes: votes received by this candidate for this particular party
Note: the data for Alaska are missing.
It is your task to pick interesting patterns and trends in the data, and decide how to present it in a suitable way, we provide only basic guidelines (see also for a few ideas below). Replicating existing work is fine (but you have to write code yourself!) Feel free to add more interesting data, for instance you may try to correlate election results, population and economic outcomes.
Your final product is a report, somewhat similar to what did you do for the plotting exercise. That must include:
- An introductory paragraph, telling what this report is about and where this data is coming from.
- A paragraph of summary information, citing at least 3 values calculated from the data.
- Two charts or tables (3 if you have 5 group members) that display information from the data (what you present is up to you).
- the final analysis.html file should be uploaded to canvas.
Unlike other assignments, you have to keep your code organized in multiple different files. This helps keep your project more modular and clear. You'll create four different files for this project:
- An analysis.rmd file that renders your report. A stub is provided.
- A file with functions that calculate summary information to be included in your report.
- A file with a function that returns your first chart or table
- A file with another function that returns another chart or table
You should save your .R files in a R/ directory. There's more
information below about how these files interact.
As with other group assignments, one person (and only one person) will begin by clicking the link that creates the GitHub repo. The whole group must work on this single repo.
If more of you click the link, that is not a problem, but now you have to decide which repo you work on.
In order to keep track of who needs to do what, GitHub has created the issues tab. Typically, GitHub Issues are used by teams to assign tasks and track progress on different parts of the project. You can easily create and assign issues on GitHub's issues tab. For this assignment, you should assign each of the components below to a different group member, and keep track of your progress by closing the issues once you've completed a task.
Each team member has to create at least one branch, make edits there, push the branch to github, and merge it back to the main branch. Everyone also has to make at least one edit directly to the main branch. It is your task to agree on what to do with branches and what to do by directly committing to the main. (Normally larger changes are done in branches and minor modifications directly to the main). Everyone also has to solve a conflict, either by merging own branch or when commiting into main branch.
As described above, you'll be creating at least four different files. Because the purpose of this assignment is to practice collaboration, each section should be completed by a different person. We'll be checking the commit history to ensure that each section was pushed by a different account. Here is additional information on each section:
analysis.rmd is the main product of this exercise. It should be self-contained, i.e. those who read it should understand what is it about and the basics about how the data is processed (but all details are not needed). It should also be addressed to general audience, those who are interested in elections but not in computer code. Hence do not show any code or messages in the report. Imagine you are working as a consultant providing reports for a politcal party—your audience wants to learn about election results but not about the underlying R code.
The analysis file should contain the following parts:
-
Initialize R: load libraries, you may want to load data here, set knitr options, etc. Ensure that the results will not be visible in the final report.
-
A brief introduction where you tell what you are doing.
-
A paragraph that contains the summary information, created by the summary-producing R script. Include the numbers either inline or as separate paragraphs as appropriate.
Try to summarize some sort of election-relevant results, e.g. total votes, not something that has little relevance to elections (e.g. fips codes).
-
Your first chart or table. It should be created by the first analysis script; in the analysis.rmd file you just print or plot it.
It should be followed (or preceeded) by a paragraph that explains what it shows, outlines the methods and summarizes the results.
-
Your second chart/table, processed and explained in the same way.
-
If you are working in a group of 5, you have to produce one more chart/table.
The first file you should save in your R/ directory should
contain function(s) that return(s)
a list of information about the data. Give it an appropriate name,
such as summary.R.
For instance, you may write a
function that tells the total number of votes for a given election year:
## A function that takes year and returns total votes for that year
describeData <- function(electionyear) {
   elections %>%
                           # we call the data 'elections' here
      filter(year == electionyear) %>%
      summarize(totalVotes = sum(totalvotes)) %>%
      pull(totalVotes)
}In your other .R files you should write functions that create visualizations/tables of that data and return these to analysis.rmd. The functions should only create the charts/tables, not print those! Return the objects (e.g. ggplot charts) and print those in your analysis.rmd. In this way you can include these into the analysis.rmd file by just calling the function at the appropriate place. This keeps your markdown much more readable. You have to create a separate R script for each analysis and give it an appropriate name, e.g. figure1.R or big-city-table.R.
You are free to come up with any kind of relevant analyses but here I list a few ideas.
I recommend you to experiment with maps. The data is at county level,
you can get the US county boundaries by map_data("county") using
ggplot library. Merge using fips code.
You may also consider to connect election data with more macro-level data,
such as immigrant population, percentage of youth, or temperature.
There are many sources where you can
get US geographic data at county level (and even more at state level), you may consider
dataset county in the openintro package.
You may also analyze the vote swings over elections, and visualize how the counties (or states) have become more democratic or republican. Can you show that this is related to, say, population size?
In terms of tables, you may show party preferences in, say, 10 largest US metro areas, or in otherwise interesting cities.
As with the previous assignment, you should add and commit your changes using git, and push your assignment to GitHub. You will submit the URL of your repository as your assignment. Only one person will need to submit, because this is configured as a group project.
At this point you should also have some experience to write your code in a clean manner. In particular, try to achieve the following:
- Proper use of libraries such as dplyr for data manipulation
- Structuring your code so that if the data changes, you can easily update your entire report
- Leveraging markdown syntax to provide structure to your report
- Clearly commenting and properly organizing your code
- Writing functions to encapsulate chunks of code that you use more than once
- Avoiding variables that are unnecessary for your analysis/report
- Creating appropriate labels for your visualizations
As you see, grading is heavily tilted toward git usage.
- Proper use of git and GitHub: 50pt
- created and assigned issues 6
- closed issues when done 6
- created branches 6
- branches uploaded to github 6
- merged branches 10
- solved conflicts 10
- informative commit messages 6
- Proper use of rmarkdown 15pt
- markdown text appropriately structured, including title, author names, section headers 10
- code chunks not overly long, most code in separate files 5
- Components of the report 15pt
- introduction 4
- summary text (values seamlessly integrated in text) 4
- charts/tables and accompanying text 7
- code 20pt
- code in appropriately named files in a folder named R 5
- appropriate functions that input the necessary arguments and output charts and tables 5
- function return structures are appropriate (a list or something similar for summary, graphs/tables for the other functions), functions do not do any printing 5
- charts, tables appropriately labeled, colored, etc. 5