-
Notifications
You must be signed in to change notification settings - Fork 0
6: Visualization Settings
Several parameters allow to observe the data using particular configurations. SDIF-Edit being designed to read any type of data, it is sometimes necessary to make some adjustments to obtain satisfactory representations. These settings are accessible mainly from the SETTINGS area.
We will note in particular the time scales, and the various parameters, adjustable thanks to the corresponding commands in the SETTINGS area. These will sometimes allow to have a more precise view on too dense data, sometimes to condense the representation according to one or more of the parameters.
Color settings can also enrich the representation. The Color button opens the color adjustment window.

This window allows you to choose a parameter whose color will depend on the points represented. By default, this is the same as the field selected on the viewer, but choosing another parameter will add a dimension to the representation.
A color palette allows you to choose the background colors and the minimum and maximum colors between which the colors of the represented points will be graded (select a color in the palette and move it to the square corresponding to the color to be modified). To obtain precision in certain data areas, a bar makes it possible to set the limits of this gradient with respect to the minimum and maximum data values (modify the sizes of the gradient areas with the mouse in the left and right parts of the bar).
After making the desired settings click Apply to observe the changes on the viewer.

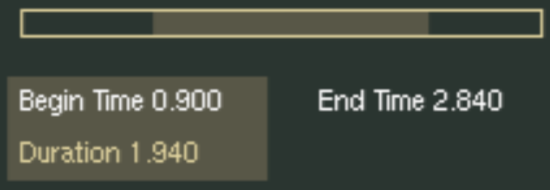
The time selection part is used to select a time portion of the data (if it has a time dimension). A preview bar gives an overview of the previewed part in relation to the whole. By selecting Begin Time or Duration, you can, by using the mouse on this bar, modify the size of this part and move it in the SDIF frames.
SDIF-Edit — J. Bresson, IRCAM 2003-2004