-
Notifications
You must be signed in to change notification settings - Fork 4
diffractive_array
baptiste edited this page Jun 22, 2014
·
5 revisions
baptiste Auguié -- 22 June, 2014
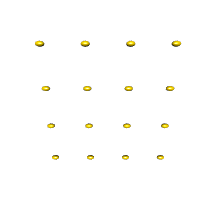
In this example we consider a 2D periodic arrangement of ellipsoids in a square array, with a separation of the order of the wavelength. The incident light is perpendicular to the array.
# dielectric function
wvl <- seq(400, 900)
gold <- epsAu(wvl)

cluster_array <- function(N, pitch = 500, a = 50, b = 30, c = b, ...)
{
  r <- as.matrix(expand.grid(x = seq(1, N) * pitch, y = seq(1, N) * pitch, z = 0))
  N2 <- NROW(r)
  sizes <- equal_sizes(a = a, b = b, c = c, N = N2)
  angles <- equal_angles(N = N2)
  list(r = r, sizes = sizes, angles = angles)
}
cl <- cluster_array(4)
rgl.ellipsoids(cl$r, cl$sizes, cl$angles, col="gold")
# visualise
rgl.viewpoint( theta = 0, phi = 20, fov = 70, zoom = 1)
array <- function(N, pitch = 500, ...){
  cl <- cluster_array(N, pitch, ...)
  dispersion_spectrum(cluster = cl, material = gold, ...)
}

params <- data.frame(N=c(1, 10, 20))
# comparison <- mdply(params, array, .progress='text')
load("finite.rda")
p <-
  ggplot(data=comparison)+ facet_wrap(~type, ncol=1, scales="free")+
labs(y=expression(sigma[ext]*" /"*nm^2),
       x=expression(wavelength*" /"*nm),
       colour = expression(N), linetype=expression(polarisation))+
  geom_line(aes(wavelength, value, linetype=polarisation,
                colour=factor(N),
                group=interaction(N,polarisation)))

p
data(G0)
pitch <- 500
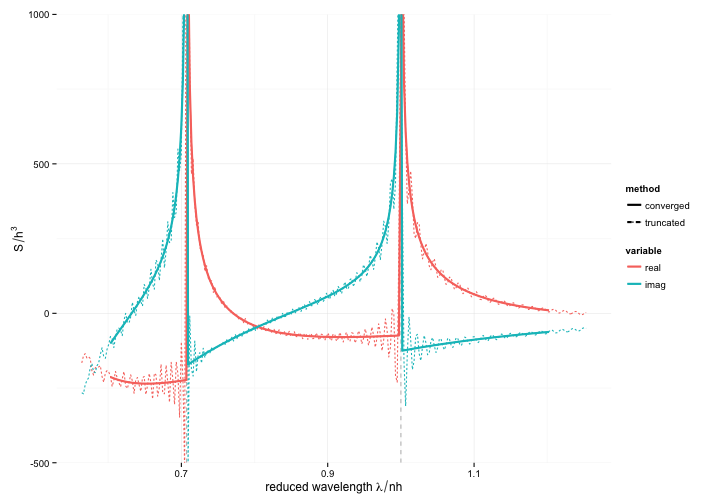
S <- array_factor(wavelength=gold$wavelength / 1.33,
                   N=200, pitch=pitch)

S$smooth <- smooth.spline(S$wavelength, Re(S$S), df=50)$y +
  1i * smooth.spline(S$wavelength, Im(S$S), df=50)$y

interpolate.fun <- function(x, y){
  list(re=approxfun(x, Re(y)),
       im=approxfun(x, Im(y)))
}

gfun <- interpolate.fun(G0$wavelength, G0$Gxx)
G <- gfun$re(gold$wavelength/pitch/1.33) + 1i*gfun$im(gold$wavelength/pitch/1.33)
alpha_0 <- polarizability_ellipsoid(gold$wavelength, gold$epsilon, medium=1.33)[,1]
alpha_1 <- 1 / (1 / alpha_0 - S$S)
alpha_2 <- 1 / (1 / alpha_0 - S$smooth)
alpha_3 <- 1 / (1 / alpha_0 - G/pitch^3)

k <- 2*pi * 1.33 / gold$wavelength
palette(RColorBrewer::brewer.pal(5,"Set1"))
par(mfrow=c(1,1),mar=c(2,2,1,1),lwd=2)
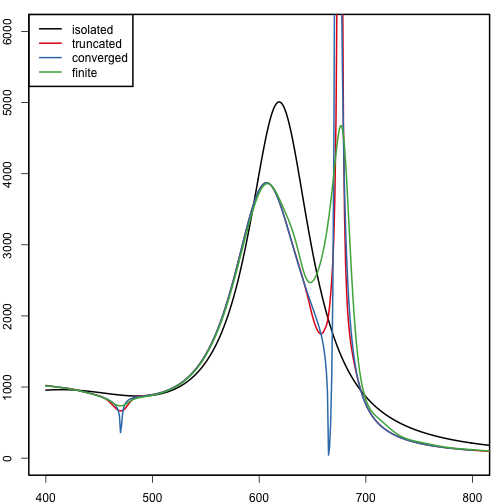
plot(gold$wavelength, k*Im(alpha_0),t="l",
     xlim=c(400,800),ylim=c(0, 6000), col="black")
lines(gold$wavelength, k*Im(alpha_2),col=1)
lines(gold$wavelength, k*Im(alpha_3),col=2)
with(subset(comparison, polarisation == "p" & N == 20 & type == "extinction"),
     lines(gold$wavelength, value/4/pi/20^2, lty=1,col=3))
legend("topleft", lty=c(1,1,1,1),col=c("black", 1,2,3),
       c("isolated", "truncated", "converged", "finite" ))