Blazor wasm PWA application with a web oidc api fighting against environment ignorance.
-
Updated
Apr 30, 2022 - C#
Global climate change refers to the rise of earth's temperature, caused by human factors. It originates from the greenhouse effect of certain gases in our atmosphere like carbon dioxide (CO2) or methane (CH4) that block the escaping heat. The concentration of these gases has risen dramatically by human impact since the mid of the 20th century, with the burning of fossil fuels (oil and gas) and deforestation being main causes of this rise. The observed and expected effects include more and longer periods of draught, wildfires and an increased number of extreme weather events.
Blazor wasm PWA application with a web oidc api fighting against environment ignorance.
Historical temperature visualization with D3 and React
World Temperature Viewer is more than just a data visualization tool; it is a conduit for knowledge transfer, fostering a greater understanding of the far-reaching impacts of global warming and climate change
[Paper] Basic signal processing on global temperature to form my own opinion concerning the climate warming
The Effect of Global Warming on Hurricane and Typhoon Occurrence
Supplemental files accompanying McTigue, N.D., Q.A. Walker, & C.A. Currin (2021) "Refining estimates of greenhouse gas emissions from salt marsh “blue carbon” erosion and decomposition."
Graphique sur le réchauffement climatique depuis une BDD. Affichage avec la librairie Libgraph en C++
Wolfram Mathematica programming project to practice manipulation and visualization of datasets.
Code for the analyses underlying the Cognitive Science Society poster, "Multimodal dynamics of explaining the mechanisms of global warming" (Paxton, Abney, Castellanos, & Sepulveda, 2016)
Your choices today can help prevent climate breakdown
GitHub repo for the Advanced Classification Sprint Team ZM3 Notebook
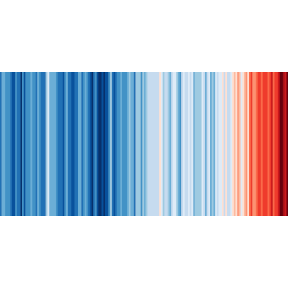
This self-named ClimateStripes4PE project aims to show and share the trend of climate change in the main meteorological variable such as temperature🌡 with the general public for the 24 regions of Peru 🌎 .
A set of exploratory and forecasting methods conducted on multiple datasets concerning global warming variables, utilizing Python
Gathering and exploration of different data to determine if there is a trend of global temperature increase across all countries through the years.
A project for analyzing historical carbon emissions data. Explore trends, sector-specific insights, and country comparisons to inform climate policies and sustainability efforts. Includes visualizations, time series analysis, and forecasting tools.
🌡️ 2100년까지의 지구 기온, 해수면, 북극 빙하, 탄소 예측 ML [완료]
Global Surface Temperature of Several Countries & their Scatter Graph: Intermediate Python
Interactive visualization of global warming data using d3.js
A tiny app to compare the carbon footprint of our activities. https://adefrutoscasado.github.io/co2-comparator/
A pioneering web platform that focuses on environmentally regenerative concepts and practices (especially regarding regenerative agriculture). It not only informs about environmental responsibility but also directs individuals to actively contribute to the treasured regen goal.
Created by Humanity