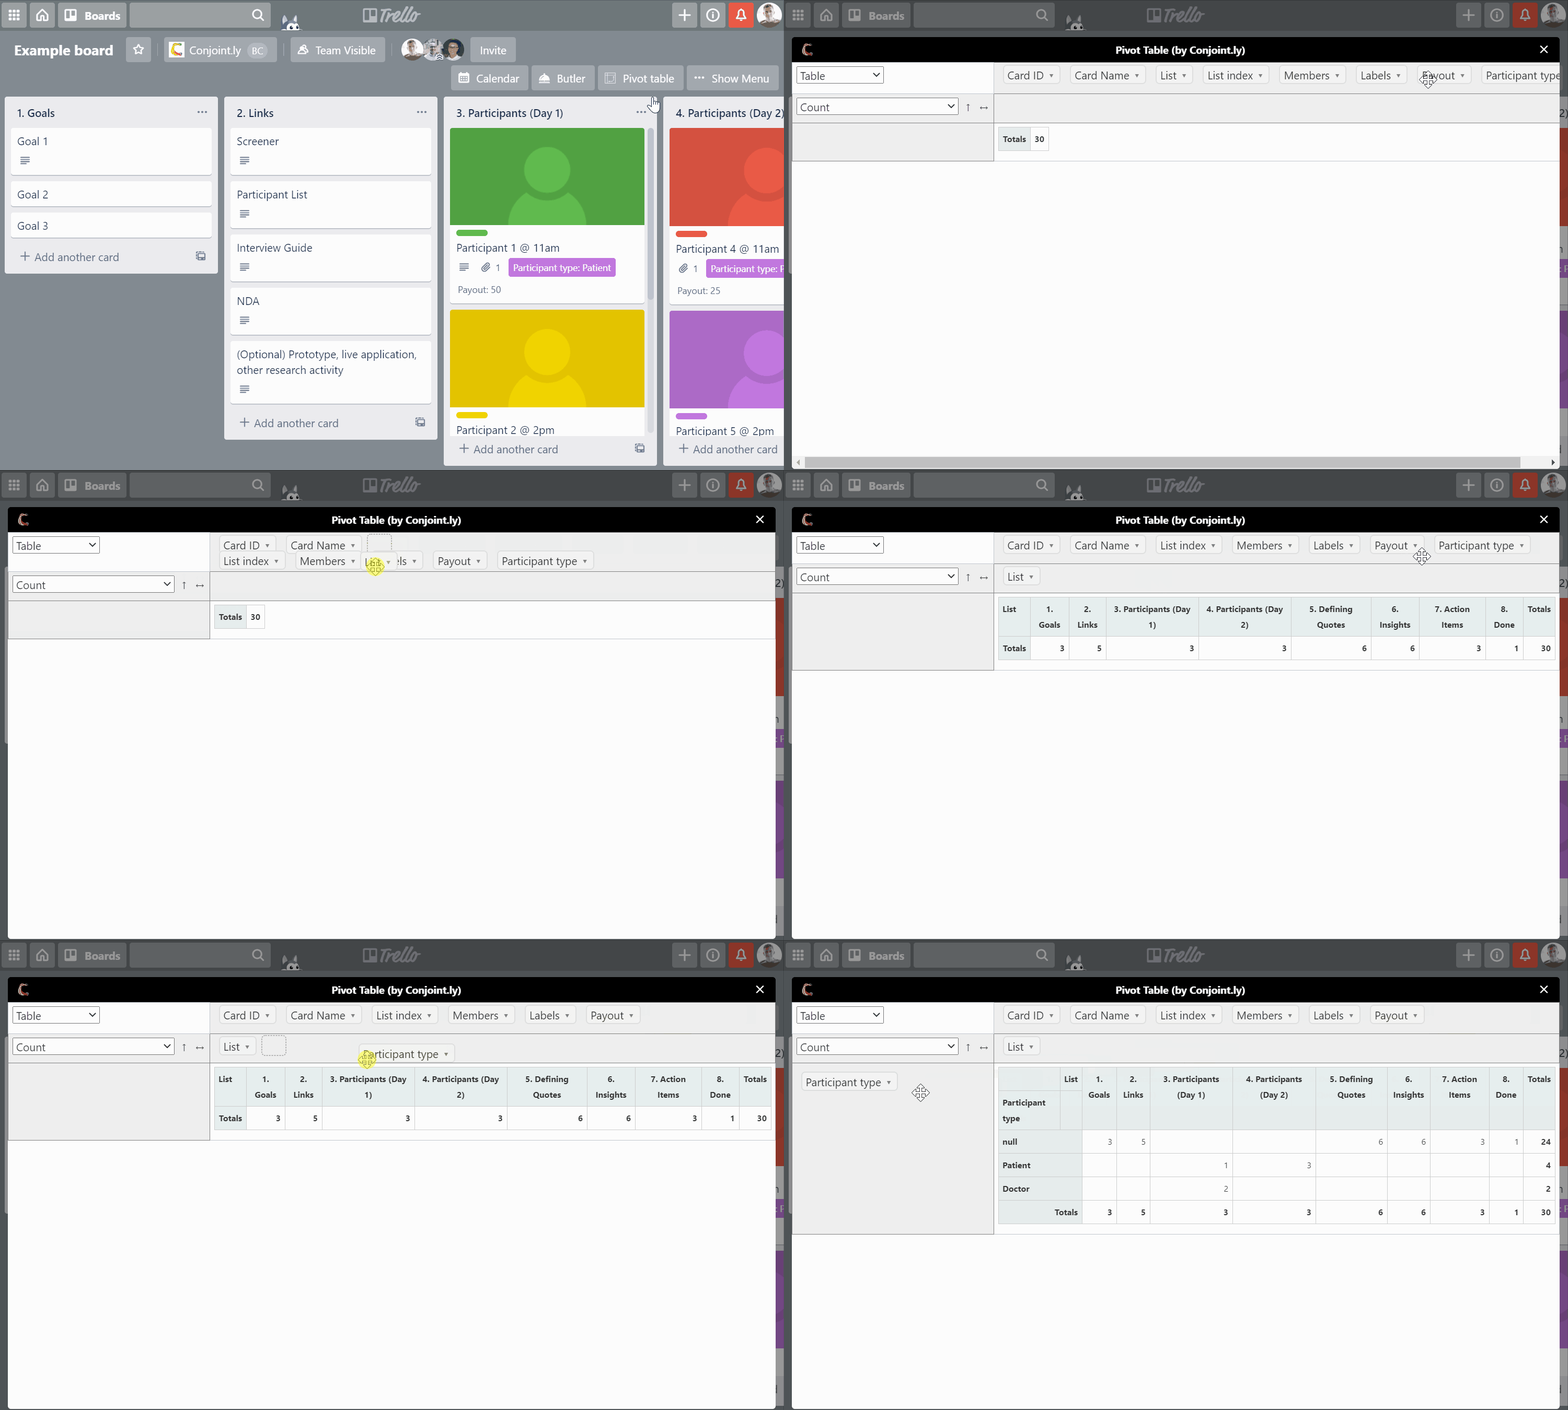
The pivot table functionality power-up was developed by the Conjointly development team as a quick way to count to-do and completed cards, as well as tally total hours budgeted for cards.
Pivot tables are the perfect solution when you need to summarise and analyse large amounts of data. In just a few clicks, you can review project efficiency and productivity data in a simple display.
🆓 Add for free (no registration required):
Conjointly Pivots are particularly useful for:
- 🗓️ Project Planning (i.e., identify and categorise development hours)
- 👀 Project Tracking (i.e., track project costs, group and sort project stages)
- ✔️ Project Reporting (i.e., measure performance, create custom reports)
Main benefits of Conjointly Pivots:
You don’t need to be a pivot wiz to start using this tool. The drag and drop functionality allows you to organise and summarise your Trello board data in moments.
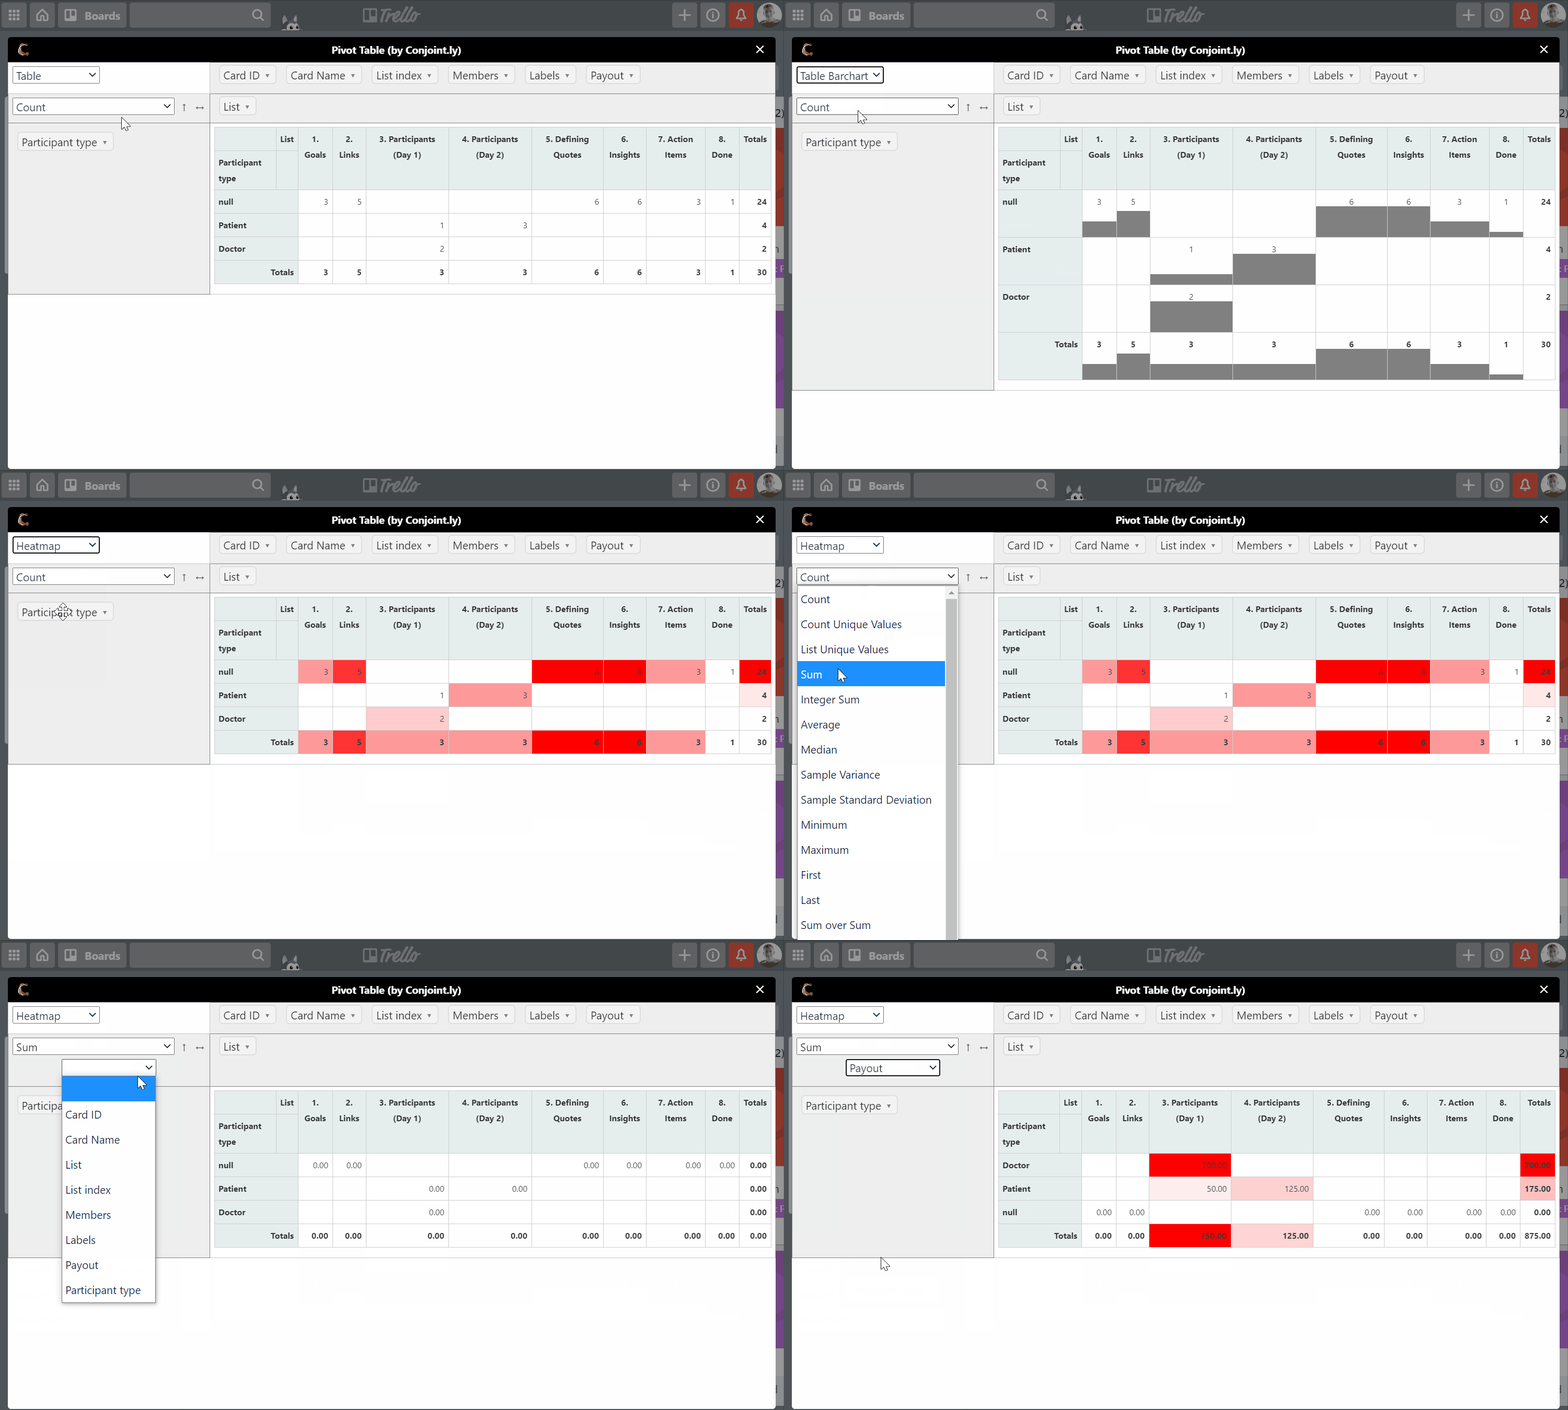
Create a functional, visually-appealing report with a pivot table in minutes. Pivot tables are fast to set up and require minimum effort. Track on-going changes to your data. A pivot table will display new data as it’s added.
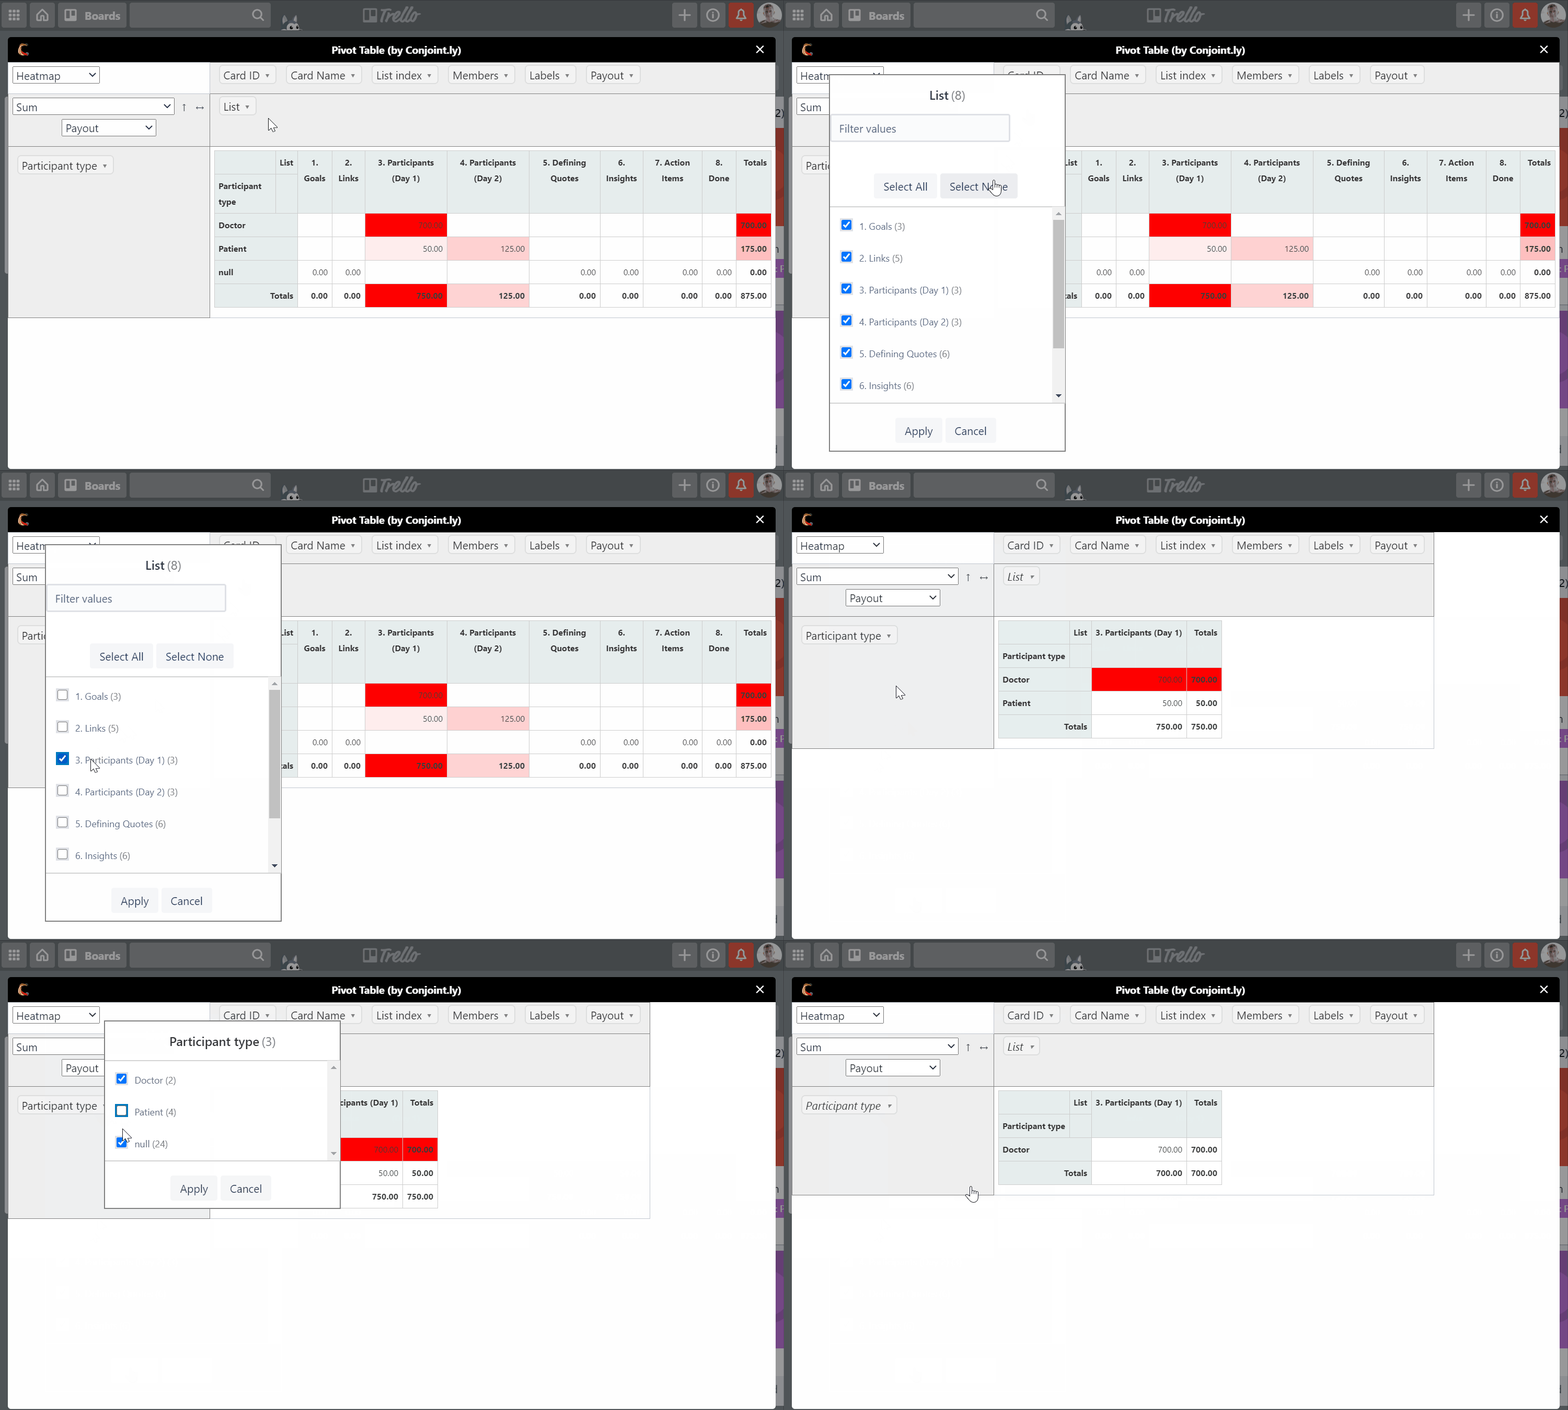
Using custom tags, each parameter can be modified with filters. Pick and choose which values you want to see and remove the rest. Want to look at completed or in-progress cards, but exclude pre-planning? A pivot table makes it simple.
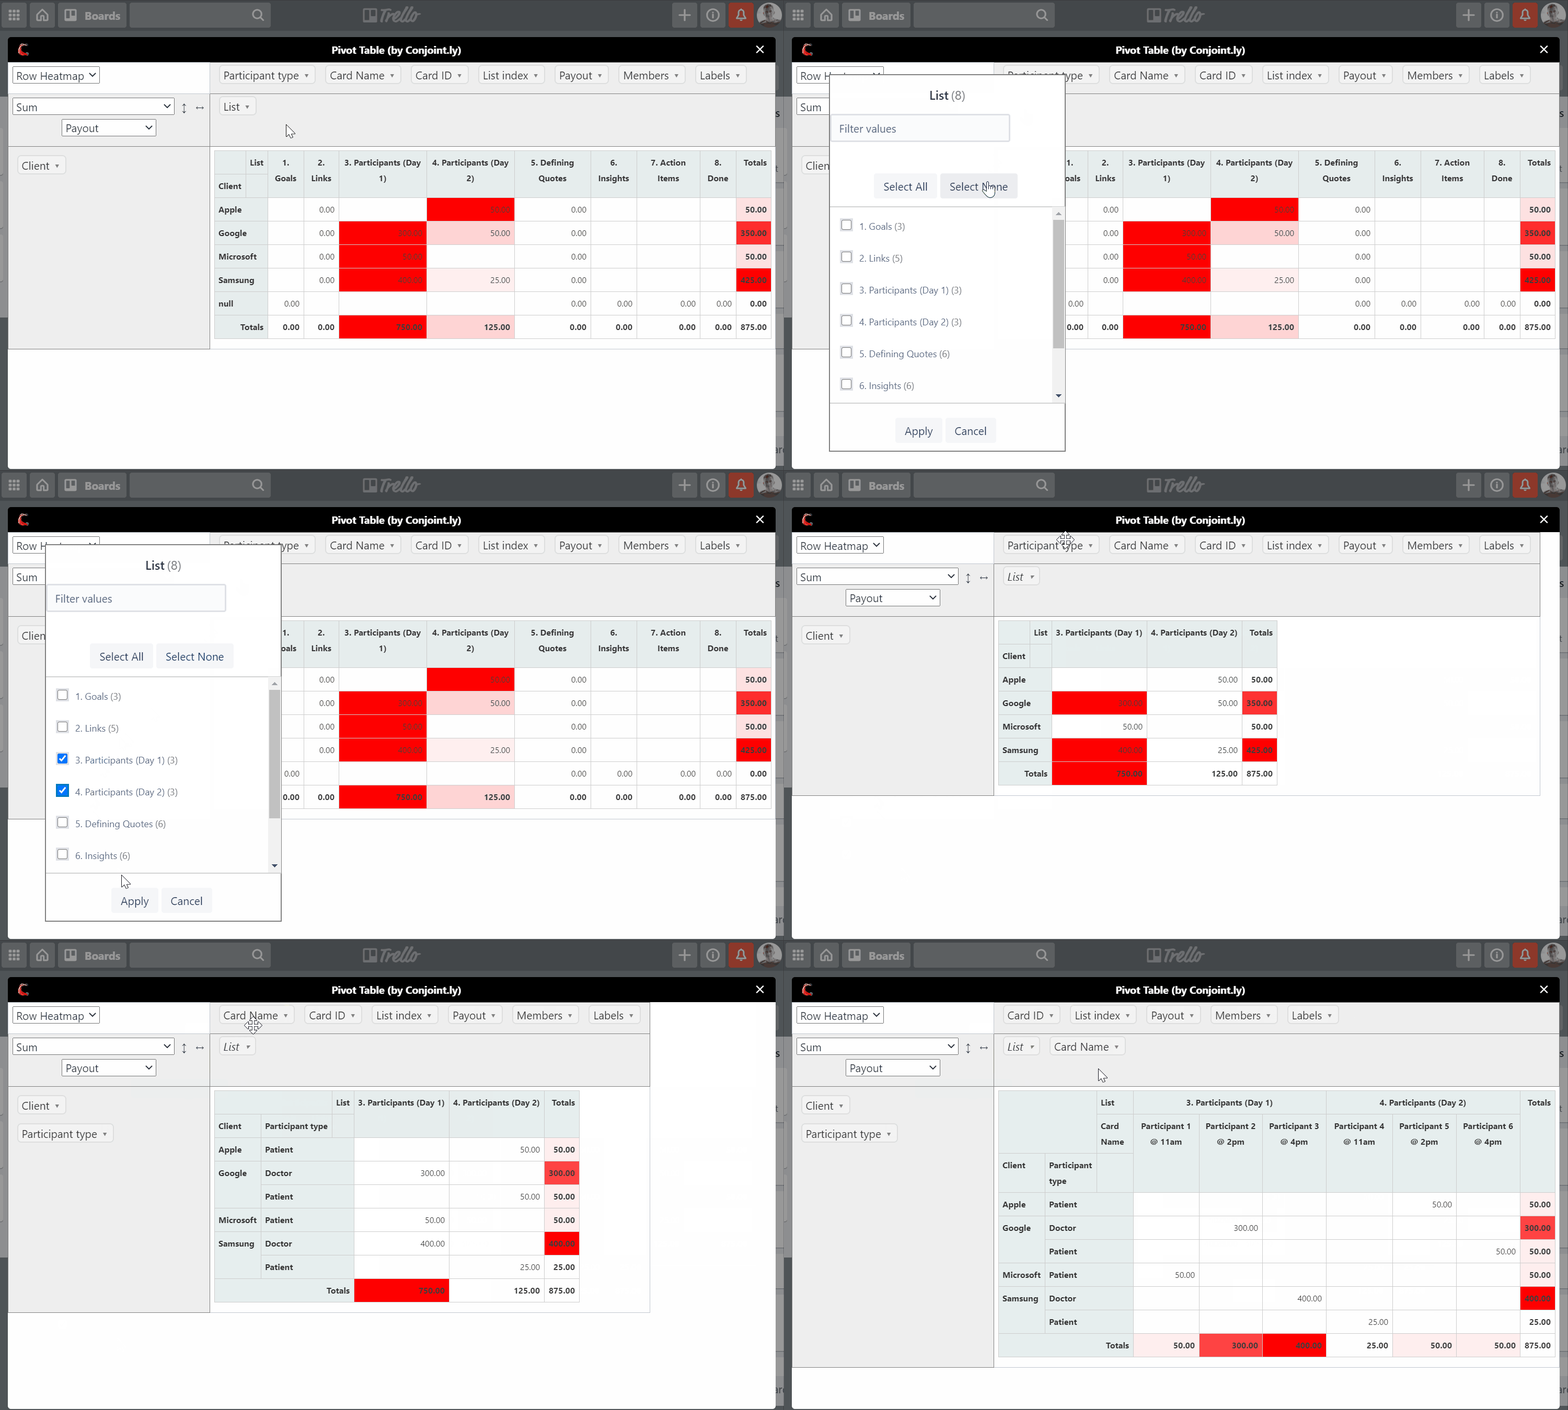
Rearrange the pivot table to suit your needs for displaying board data. Group your cards any way you like. Sort by date, project, individual, or a custom field to access your data the way you want it.
This project is open source, and contributions are welcome. You can use GitHub issues to report issues or request features.
It is an open-source project. Learn more about Conjointly and about the project itself.
🎤 Suggest more uses for this Pivot tool and provide your feedback at support@conjointly.com.


