Home
The application came about as my astrophotography hobby and collection of equipment was growing.
I initially purchased a Unihedron Sky Quality Meter, USB version and had this connected to the laptop that was managing the telescope rig and running the imaging software. The imaging software can then read the Sky Quality from the device and embed that data into the astrophotography images for example.
You can watch a bit more about this SQM meter and the installation of this SQM device onto my observatory in here:
YouTube - Unboxing and Installing Unihedron Sky Quality Meter (SQM)
This was working great, and then sometime later, I purchased a second mount and now had two imaging rigs running.....you can see where this is going!
I had originally tried shared the USB device via a small USB to TCP application that I found online, and although this did work, reliability was poor. You can watch more about this here:
YouTube - Share USB connected Sky Quality Meter device across multiple rigs/software simultaneously.
The Unihedron SQM protocol is public and I thought I would go ahead and try to write a TCP server for interfacing to the USB device. The weather in Cyprus had been cold, wet and windy, so not possible to go out and about or get any astrophotography done, so thought I would use this time to attempt this project. And that is where we are now!
The application was written in C# on Visual Studio 2022 (.Net 6). It had been many years since I had written any software, so there was a lot of head scratching, _lots _and _LOTS _of Google searches, but got there in the end! The code maybe doesn't look pretty, but it does appear to be working!

The top left of the form contains the serial information, port and polling interval, and the Connect/Disconnect button.
When you first connect to the SQM, the 'ix' command is sent, and this returns the unit information namely: Protocol version, Model, Feature Version and Serial Number.
The last message shows the raw last response received from the SQM.
The top right shows the TCP Server port number and Run/Stop button.
The last request is also shown, which IP Address and Port sent the request, the message in this image 'rx' was the command and the DateTime stamp of the request.
The 'rx' and 'ux' command responses are collected and pushed into the snapshot. These are then displayed onto the form.
The Bortle class and the NELM are derived from the Average MPas reading. The colour scale and the Bortle/NELM is based on the Wikipedia Page Bortle Scale.
The trend will populate a new pixel width of data with each logging interval, the position of the series data is an approximate based on pixel scale and the value vs range settings of the chart.
The trend will scroll from right to left, once the width of the trend exceeds the width of the form, a play/pause button appears at the top right of the trend. If you click 'Pause' icon, it stops scrolling and you can use the scroll bar to look back at data rolled off the left. Pressing 'Play' icon again will resume autoscrolling.
- Serial Connected (green) / Disconnect (red) state is shown. If there was an error in the connection it will show Retry (yellow), it will attempt to retry the connection for up to 20 attempts.
- Serial Poll will blink green when a new serial poll is performed at the serial interval.
- If you click the Serial Poll box, you can access a menu to pull up the snapshot data 'Latest Responses'

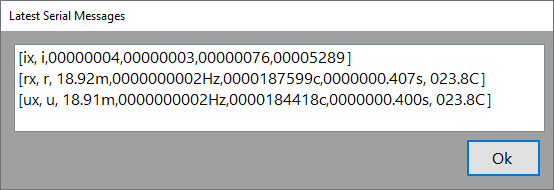
This will update on each serial poll. The window will contain the latest command and response for each of the valid supported commands, 'ix','rx' and 'ux' - From this menu you can also force a send of the 'ix', 'rx' and 'ux' commands. No need to wait for a poll interval.
- If you click the Serial Poll box, you can access a menu to pull up the snapshot data 'Latest Responses'
- Server status - Running/Stopped is displayed, green when running.
- Server clients count - each time a client connects and requests data, this box will blink green, it will also show the number of concurrent connected clients.
- Memory - The number of datapoints added to the memory store is shown, each time a logging interval occurs, this box will blink green.
- If you click the memory box a menu will appear and you can access the list of data points. This list will automatically update as each logging interval occurs. You can also force a clear of the memory store.


- If you click the memory box a menu will appear and you can access the list of data points. This list will automatically update as each logging interval occurs. You can also force a clear of the memory store.