ca_cnty  = st_read(here("data", "CA", "CA_Counties", "CA_Counties_TIGER2016.shp"))
ca_ozone = st_read(here("data","CA", "CA_ozone_2017.GPKG"))
ca_ozone = st_transform(ca_ozone, st_crs(ca_cnty))
st_crs(ca_ozone) == st_crs(ca_cnty)This custom function wraps together all the essential components to generate a krige. You can specify your study area, points, and nugget/range for your krige here.
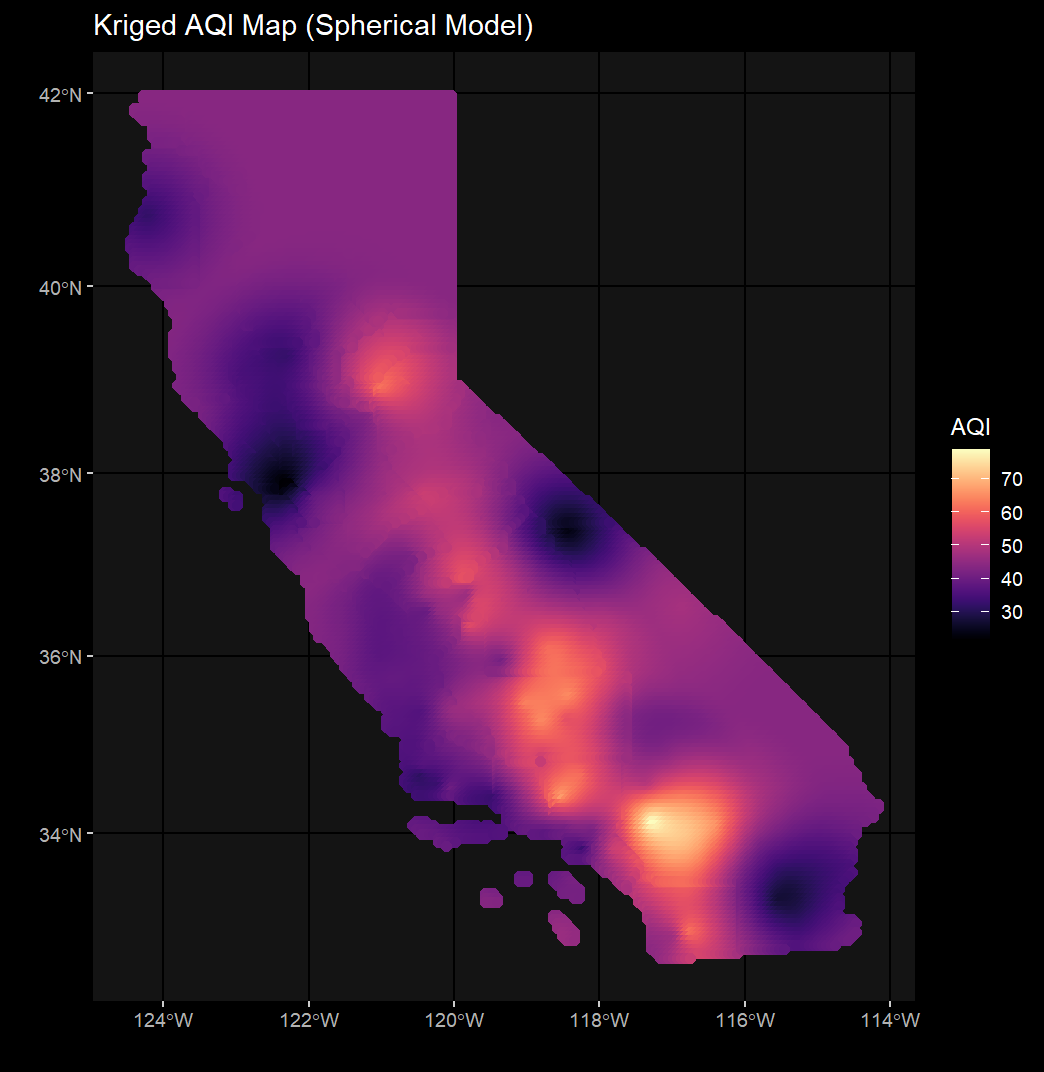
vgm_krige_results = vgm_krige_analysis(study_area_sf = ca_cnty,
                                       points_sf = ca_ozone,
                                       variable_name = "AQI")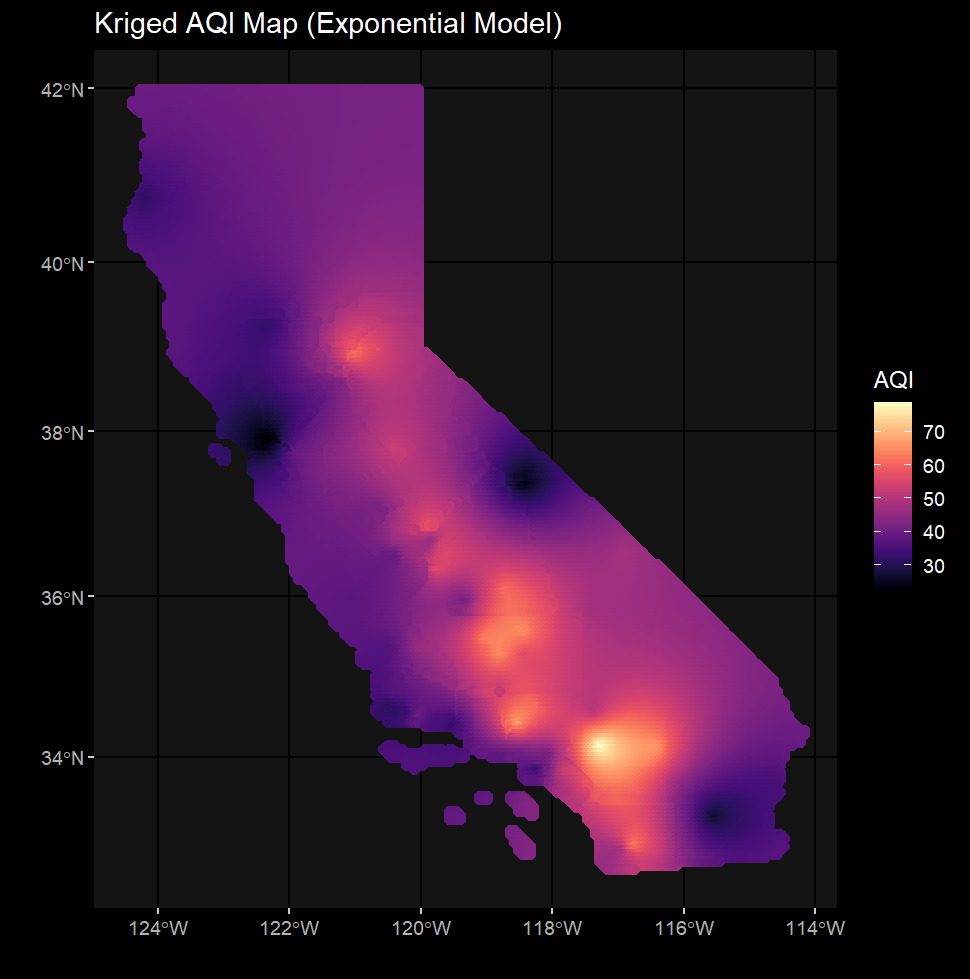
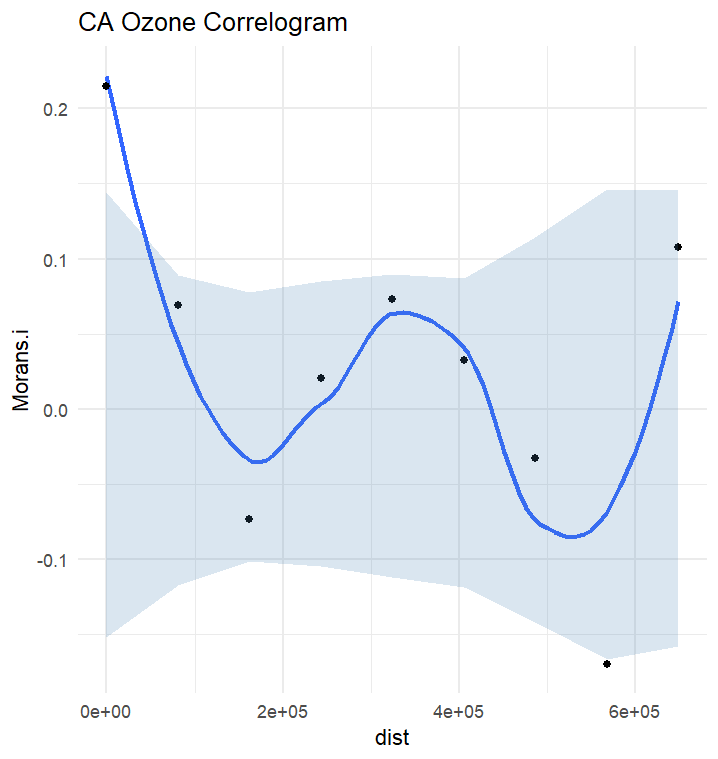
Correlogram_Function.R contains the calculate_morans_i() custom function which loops through unique distance classes and calculates Moran's I at those distances. Confidence intervals are additionally calculated in order to generate an envelope and determine the presence/abscence of autocorrelation in our data.
source("path/to/Correlogram_Function.R")ca_cnty = st_read(here("data", "CA", "CA_Counties", "CA_Counties_TIGER2016.shp"))
ca_ozone = st_read(here("data","CA", "CA_ozone_2017.GPKG"))
ca_ozone = st_transform(ca_ozone, st_crs(ca_cnty))
st_crs(ca_ozone) == st_crs(ca_cnty)# 2.1: Create your linear model with lm()
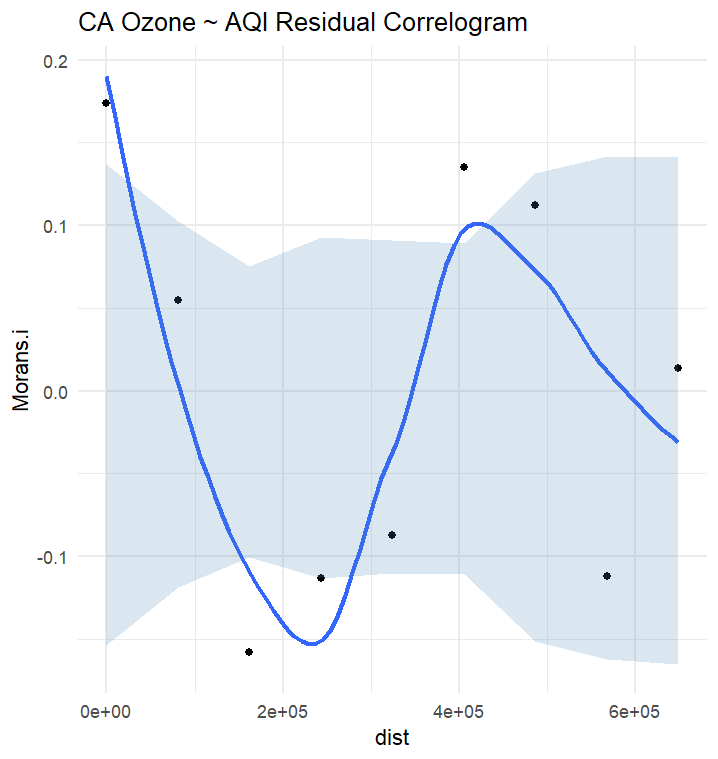
aqi_lm = lm(ozone ~ AQI, data = ca_ozone)
# 2.2: Inspect the residuals by looking at the fitted residuals & QQPlot
par(mfrow = c(1,2))
plot(aqi_lm, which = 1)
plot(aqi_lm, which = 2)
# 2.3: Extract residuals to ca_ozone from the model fit!
ca_ozone$resids = residuals(aqi_lm)ozone_correlogram_results = correlogram_calculator(ca_ozone, variable_name = "ozone")
resid_correlogram_results = correlogram_calculator(ca_ozone, variable_name = "resids")