This repository has been archived by the owner on Dec 20, 2021. It is now read-only.
-
Notifications
You must be signed in to change notification settings - Fork 27
BitcoinGraph
KevinSmall edited this page Sep 14, 2018
·
2 revisions
Let's consider the genuine bitcoin transaction 84f3ff57816950ec4eed0cb800182b91995ceb10effd422f74b1f3c063a1d6b0.
If you take a look at this tx on a conventional block explorer (click the link above), you'll see that it is a transaction involving two addresses, although this is not very intuitive when viewing like this:

This transaction can be represented as a 2D graph like this:

The key to the above diagram is:
| Item | Description |
|---|---|
| Addr A | Address 1KEyvenDoR2pPGsioybSZhcMKHKvi7JsMk |
| Addr B | Address 17mjNZWa3LVXnpiewKae3VkWyDCqKwt7PV |
| Tx | Transaction 84f3ff57816950ec4eed0cb800182b91995ceb10effd422f74b1f3c063a1d6b0 |
| E1 | Edge 1. This edge moves 12273 mBTC into the Tx, and 12232 mBTC from the Tx back into Addr A ("giving change"). |
| E2 | Edge 2. This edge moves 40 mBTC from the Tx into Addr B. |
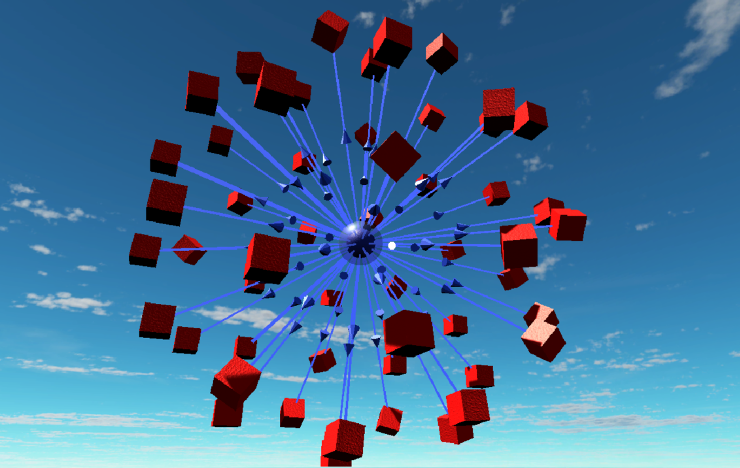
The blockchain3D project takes the above logic and projects it into 3D. Keeping a similar convention of red cubes for addresses and blue spheres for transactions, we can view bitcoin data like this:

Or like this, a so called "Kadupul Flower" that shows a transaction associated with an exchange, involving very many addresses:
