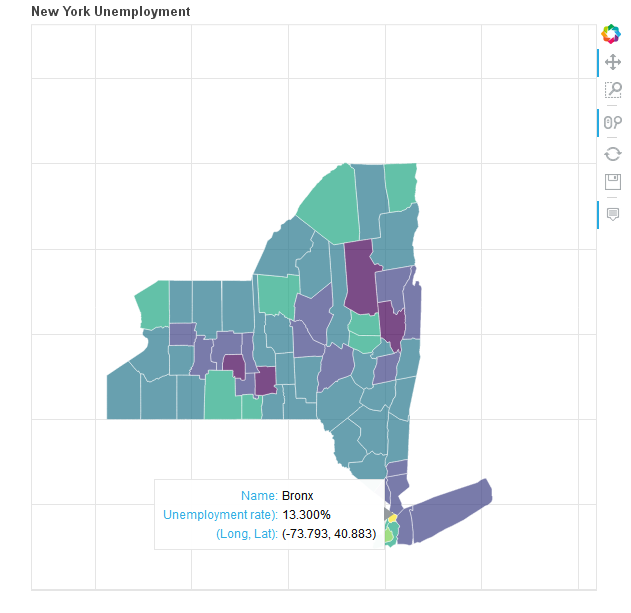
Using Bokeh python library for interactive visualization which uses web browsers for representation of graphs.
This notebook shows creation of interactive graphs with Bokeh Library
- Install
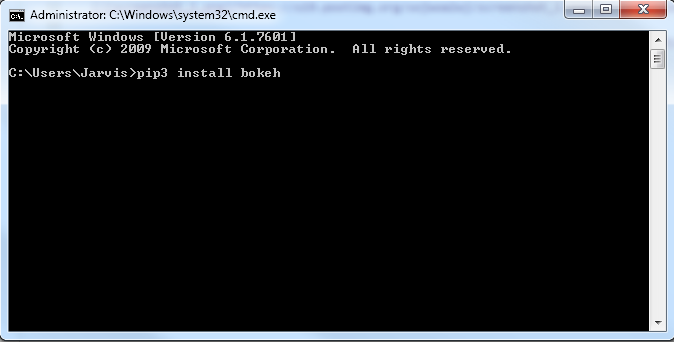
pip3 install bohekto install the source Bokeh library.
##Importing library for bar data
from bokeh.charts import Bar, output_file, show, output_notebook
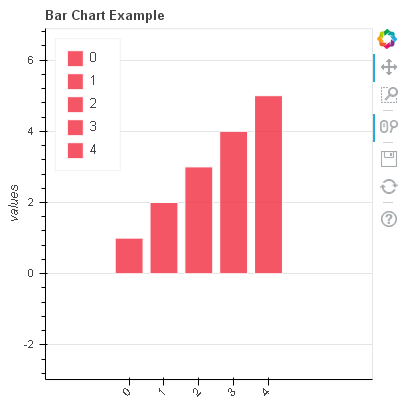
##Bokeh Inline Output1: [Bar Graph]
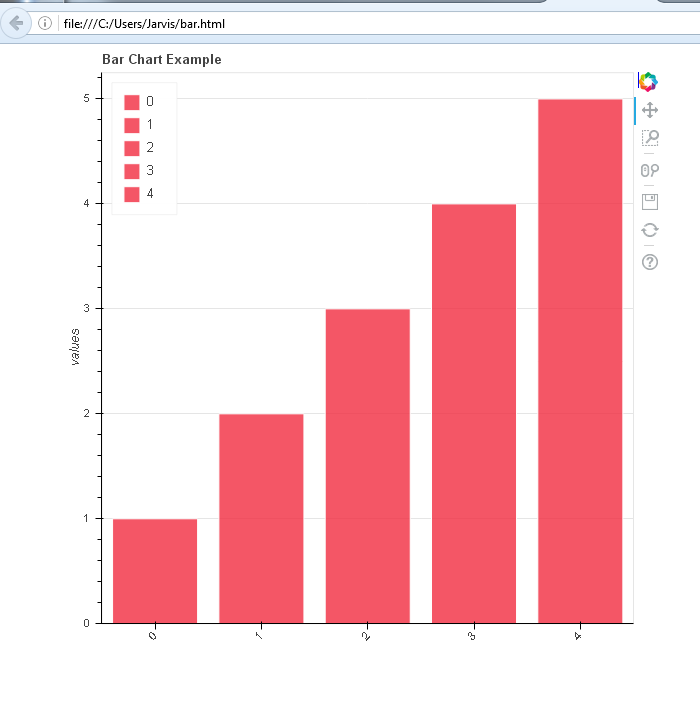
##Bokeh Local Output2: [Bar.html]
