Performance Snippet. 性能片段。
通过adb shell脚本,收集Android性能数据,输出csv格式文件,通过gnuplot绘图展示
Collect Android performance data via adb shell script, output the data in CSV format, and display it drawing by gnuplot.
- 收集CPU/内存/FPS使用数据
- TODO:收集Network/LoadAver使用数据
- 记录数据到一个易于阅读或处理的CSV格式文件
- 通过gnuplot将数据绘制为图表
- Collect CPU/MEM/FPS usage
- TODO: Collect Network/LoadAver usage
- Record performance data to a file, which has a CSV format that is easily readable by humans or processed by computer programing language
- Plots data as a chart using gnuplot
A typical data file that PerfSnippet collected and recorded:

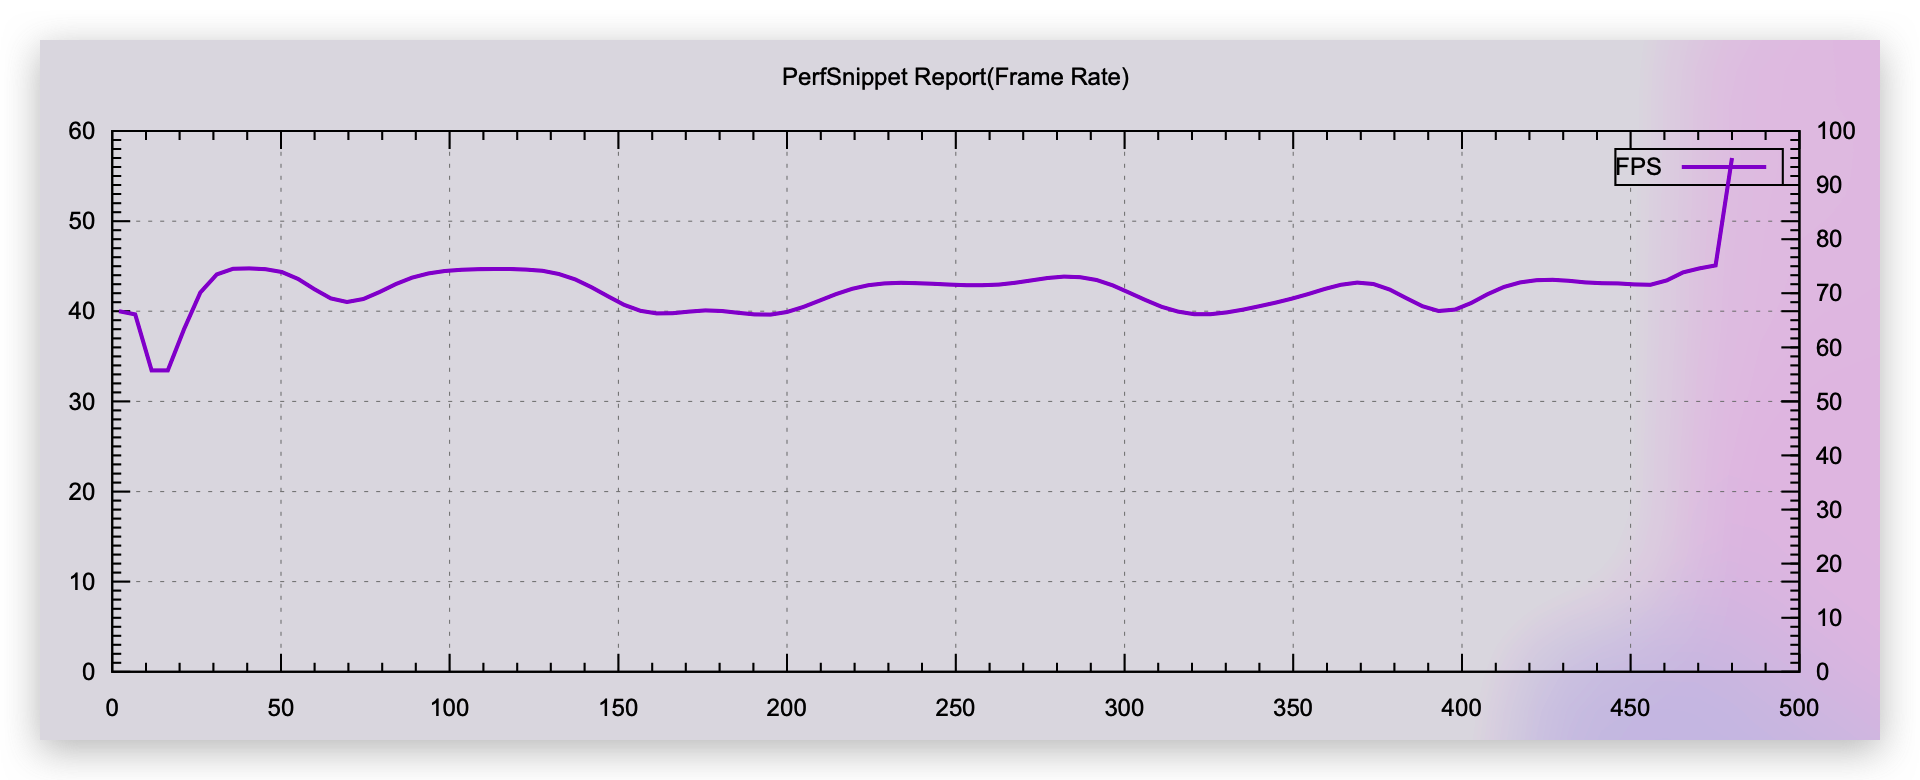
Draws to charts by gnuplot:

FPS charts:
Star, then git clone or download via Releases.
Note: init submodule after git clone:
git submodule init
git submodule update
run.sh as entry and it will proceed env setup, performance data recording and output picture drawing. Feature switch controlled by env args:
run.sh启动工具,自动完成环境搭建、数据收集、绘图工作,修改变量可以实现功能开关控制:
arg=var source run.sh
Feature switch controlled by env args as follow:
参数列表(功能列表):
- ps_debug: enable to print debug message 打印调试信息
- ps_interval: set number to control time interval between ticks 控制数据采集时间间隔
- ps_duration: set number to control the duration of the executio 控制采集多长的时间
- ps_adbtarget: set to control the adb target to run, default is current connected device. It works under where devices is more than one, but will not connect to device automatically. 控制运行的adb device设备,默认为当前设备。不会自动连接设备,只用于在多设备环境下区分设备
- ps_cpuinfo_disabled ps_meminfo_disabled ps_gfxinfo_disabled: enable to disable record corresponding data 不记录对应类别的数据
- Run, interal ticks is 2 second, duration 600 seconds
ps_inteval=2 ps_duration=600 source run.sh
Before using gfxinfo collecting, you must execute command "setprop debug.hwui.profile true" and execute "am restart" via adb shell, otherwise FPS cannot be counted.
Copyright (C) <2022> NiKo Zhong
Permission is hereby granted, free of charge, to any person obtaining a copy of this software and associated documentation files (the "Software"), to deal in the Software without restriction, including without limitation the rights to use, copy, modify, merge, publish, distribute, sublicense, and/or sell copies of the Software, and to permit persons to whom the Software is furnished to do so, subject to the following conditions:
The above copyright notice and this permission notice shall be included in all copies or substantial portions of the Software.
THE SOFTWARE IS PROVIDED "AS IS", WITHOUT WARRANTY OF ANY KIND, EXPRESS OR IMPLIED, INCLUDING BUT NOT LIMITED TO THE WARRANTIES OF MERCHANTABILITY, FITNESS FOR A PARTICULAR PURPOSE AND NONINFRINGEMENT. IN NO EVENT SHALL THE AUTHORS OR COPYRIGHT HOLDERS BE LIABLE FOR ANY CLAIM, DAMAGES OR OTHER LIABILITY, WHETHER IN AN ACTION OF CONTRACT, TORT OR OTHERWISE, ARISING FROM, OUT OF OR IN CONNECTION WITH THE SOFTWARE OR THE USE OR OTHER DEALINGS IN THE SOFTWARE.