-
-
Notifications
You must be signed in to change notification settings - Fork 53
Test Bench
The Test Bench serves as a helpful tool for batch testing of patches & extensions across several tester apps.
If your intention is to use the tool to actually patch an application OR run an extension for extracting/generating something using an application, then please use Main GUI instead.
On Windows, the tool is available as WARP_bench.exe inside the win32 folder.
On Linux (Debian-based), the tool is available as WARP_bench inside the deb32 OR deb64 folder (depending on which OS & branch you have).
The timestamp on the title reflects the latest update (i.e. last commit time).
If you remove or mess up the .git folder the timestamp might not appear
Unlike the Main GUI, here we have upto 3 lists of items to cherry pick test inputs from and also a seperate section is needed for sending the test results.
Therefore the interface has been logically divided into 4 tabs as shown.
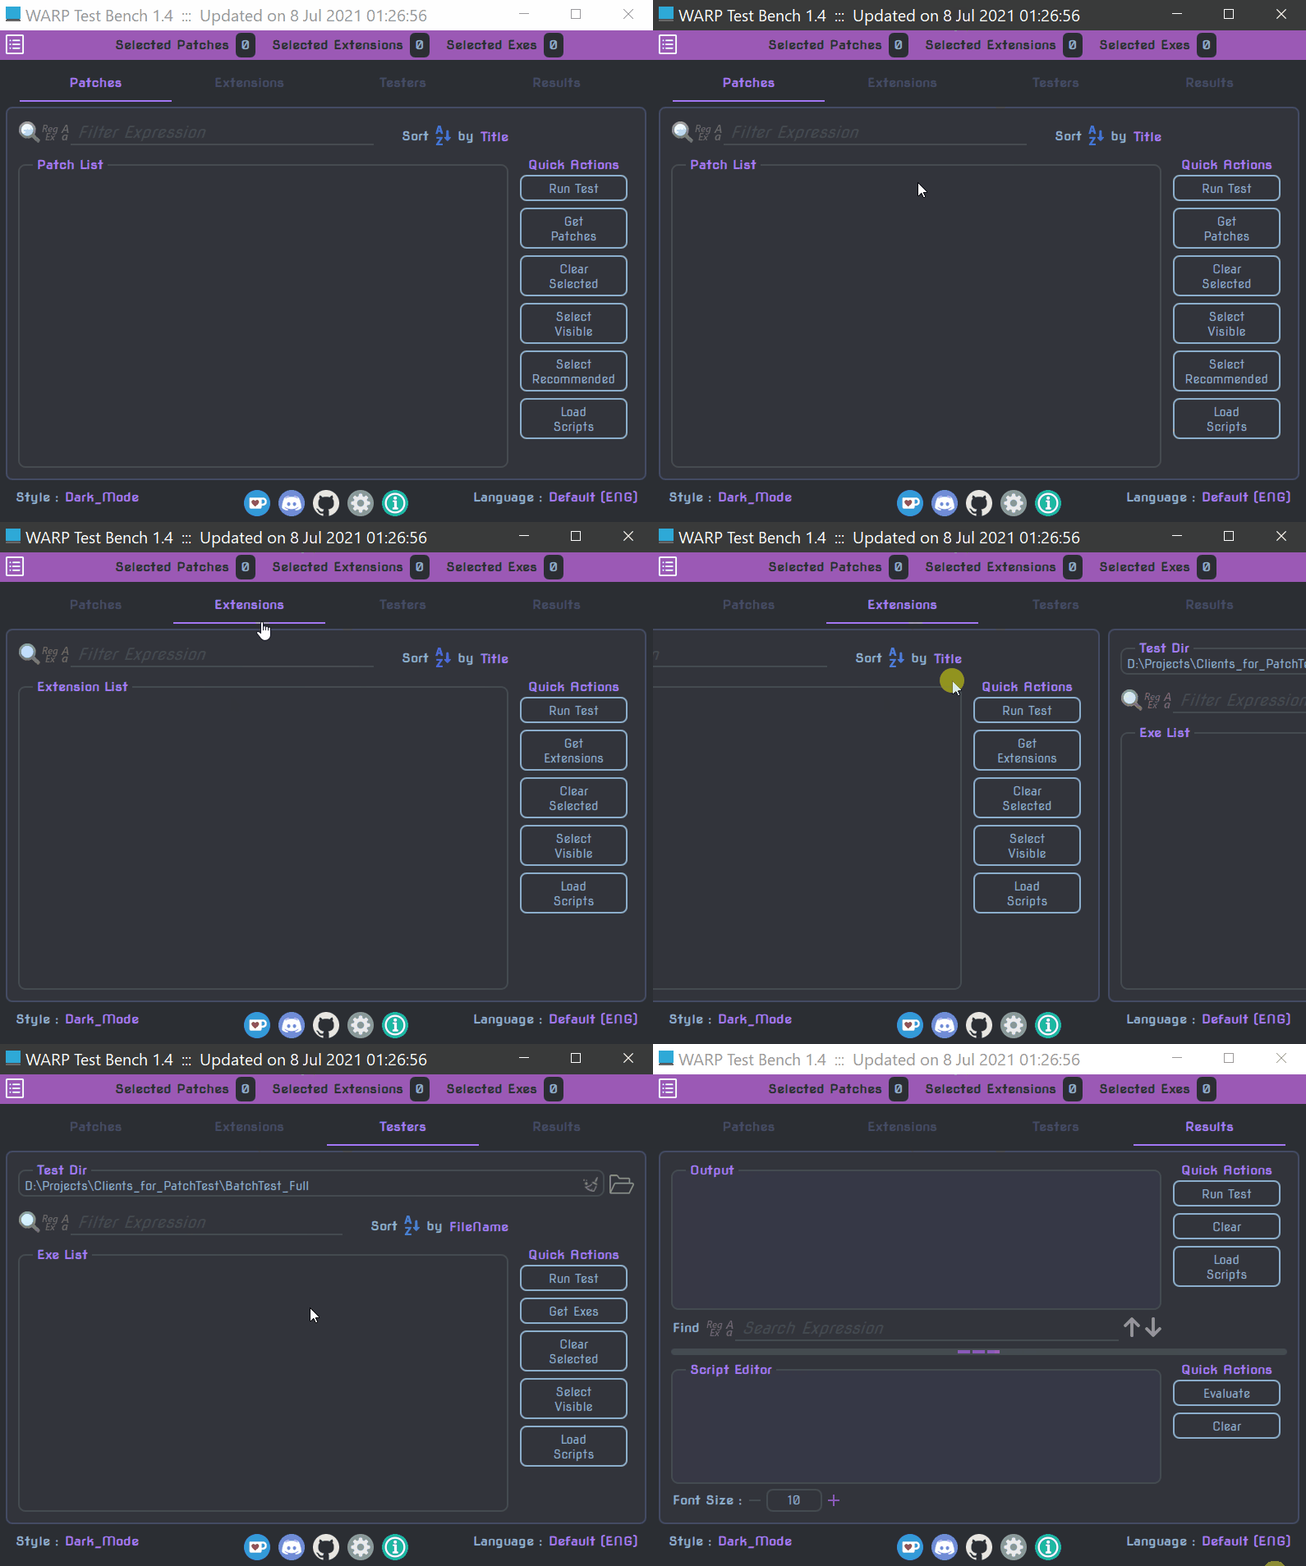
As you can see, there are 3 ways to switch between these tabs:
-
Click on the respective tab title.
-
Swipe left or right (works for adjacent tabs)
-
Press
Ctrl+Tabto move to next tab andCtrl+Shift+Tabto go backwards.
Just like Main GUI, all the first 3 tabs contains a list from which we need to select items, and they all have a Filter & Sort field to help with the selection process.
Each tab contains a bunch of 'Quick Actions' which are the most frequent tasks to be done in each tab.
As the name suggests this tab is concerned with loading and selection of patches to be tested.
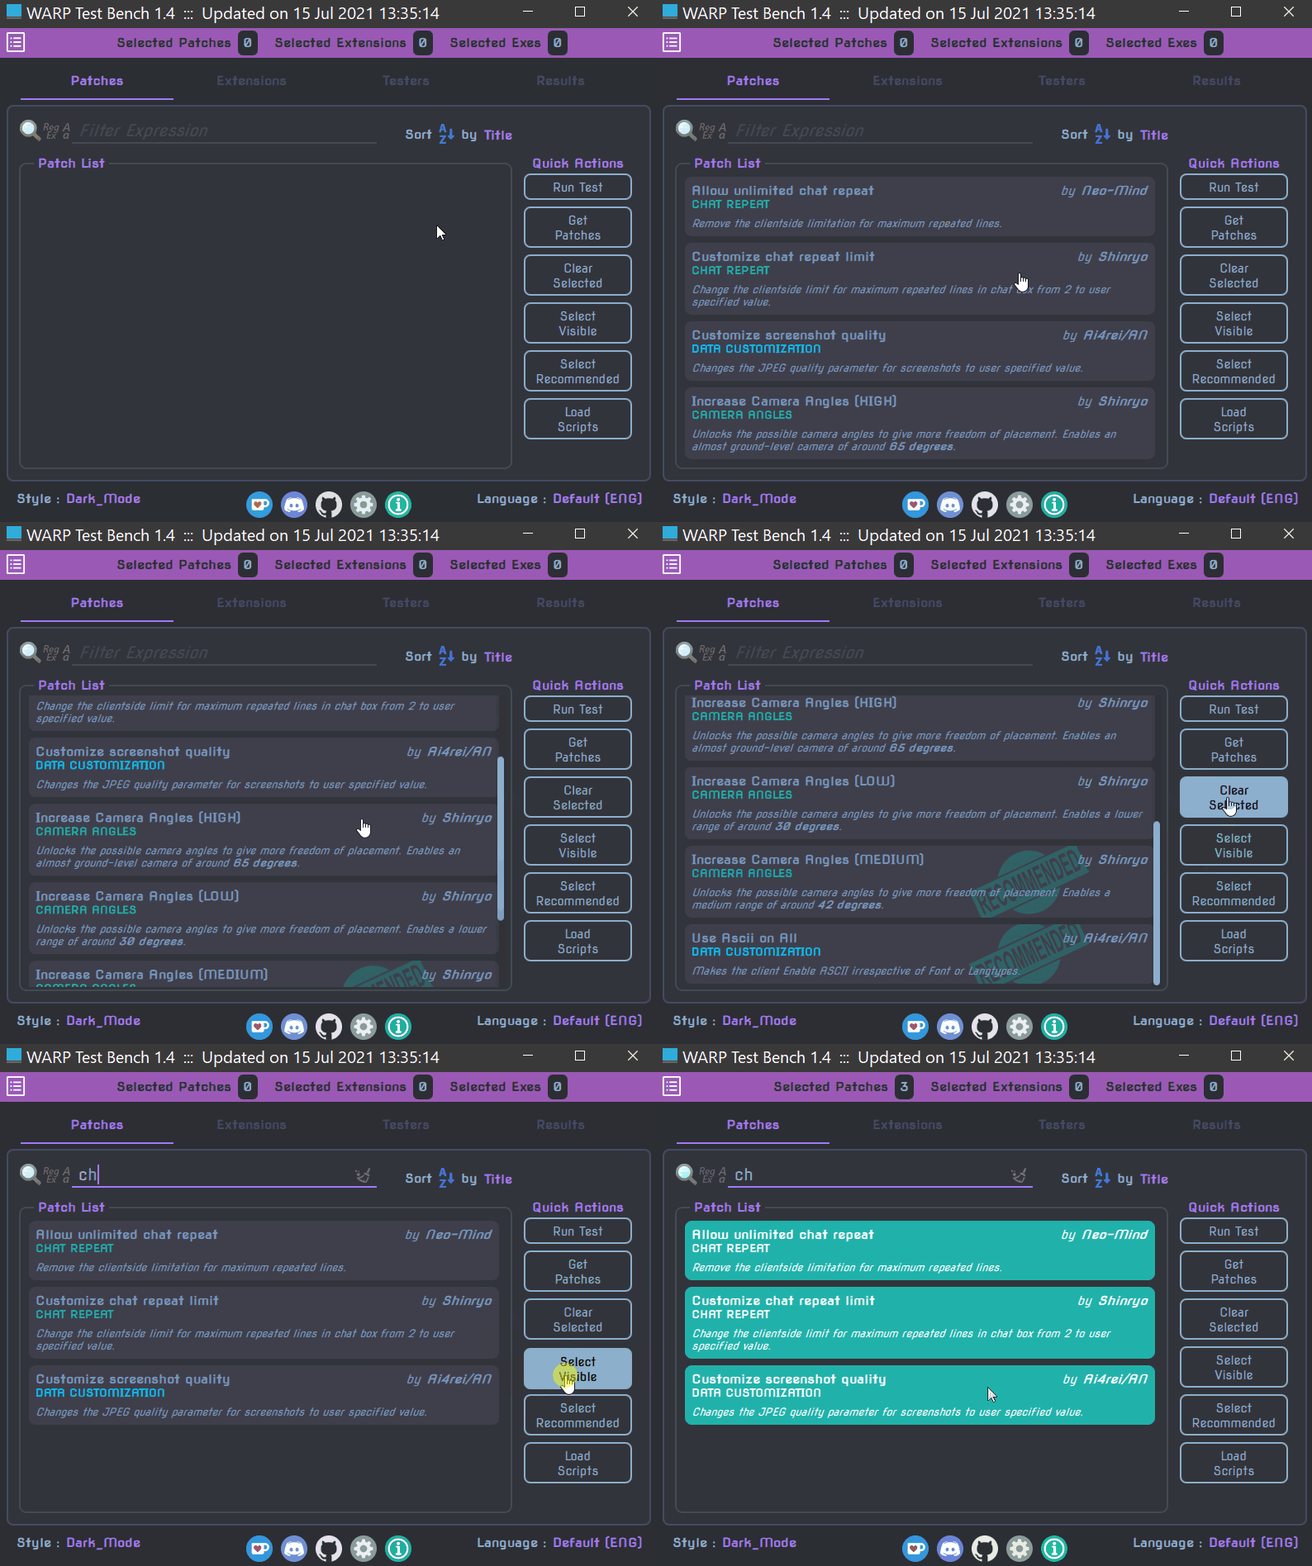
Quick Actions available:
-
Get PatchesPopulates the list of patches from the definitions in 'Patches.yml'.
-
Clear SelectedClears current selection of patches.
-
Select VisibleSelect all visible patches. Use the filter input to hide unnecessary patches.
-
Select RecommendedSelects all patches marked as 'Recommended'.
-
Load ScriptsLoad all changed/modified QJS scripts (since last time they were loaded) provided under 'Scripts' folder hierarchy (except for 'Init').
This tab is concerned with loading & selection of extensions to be tested.
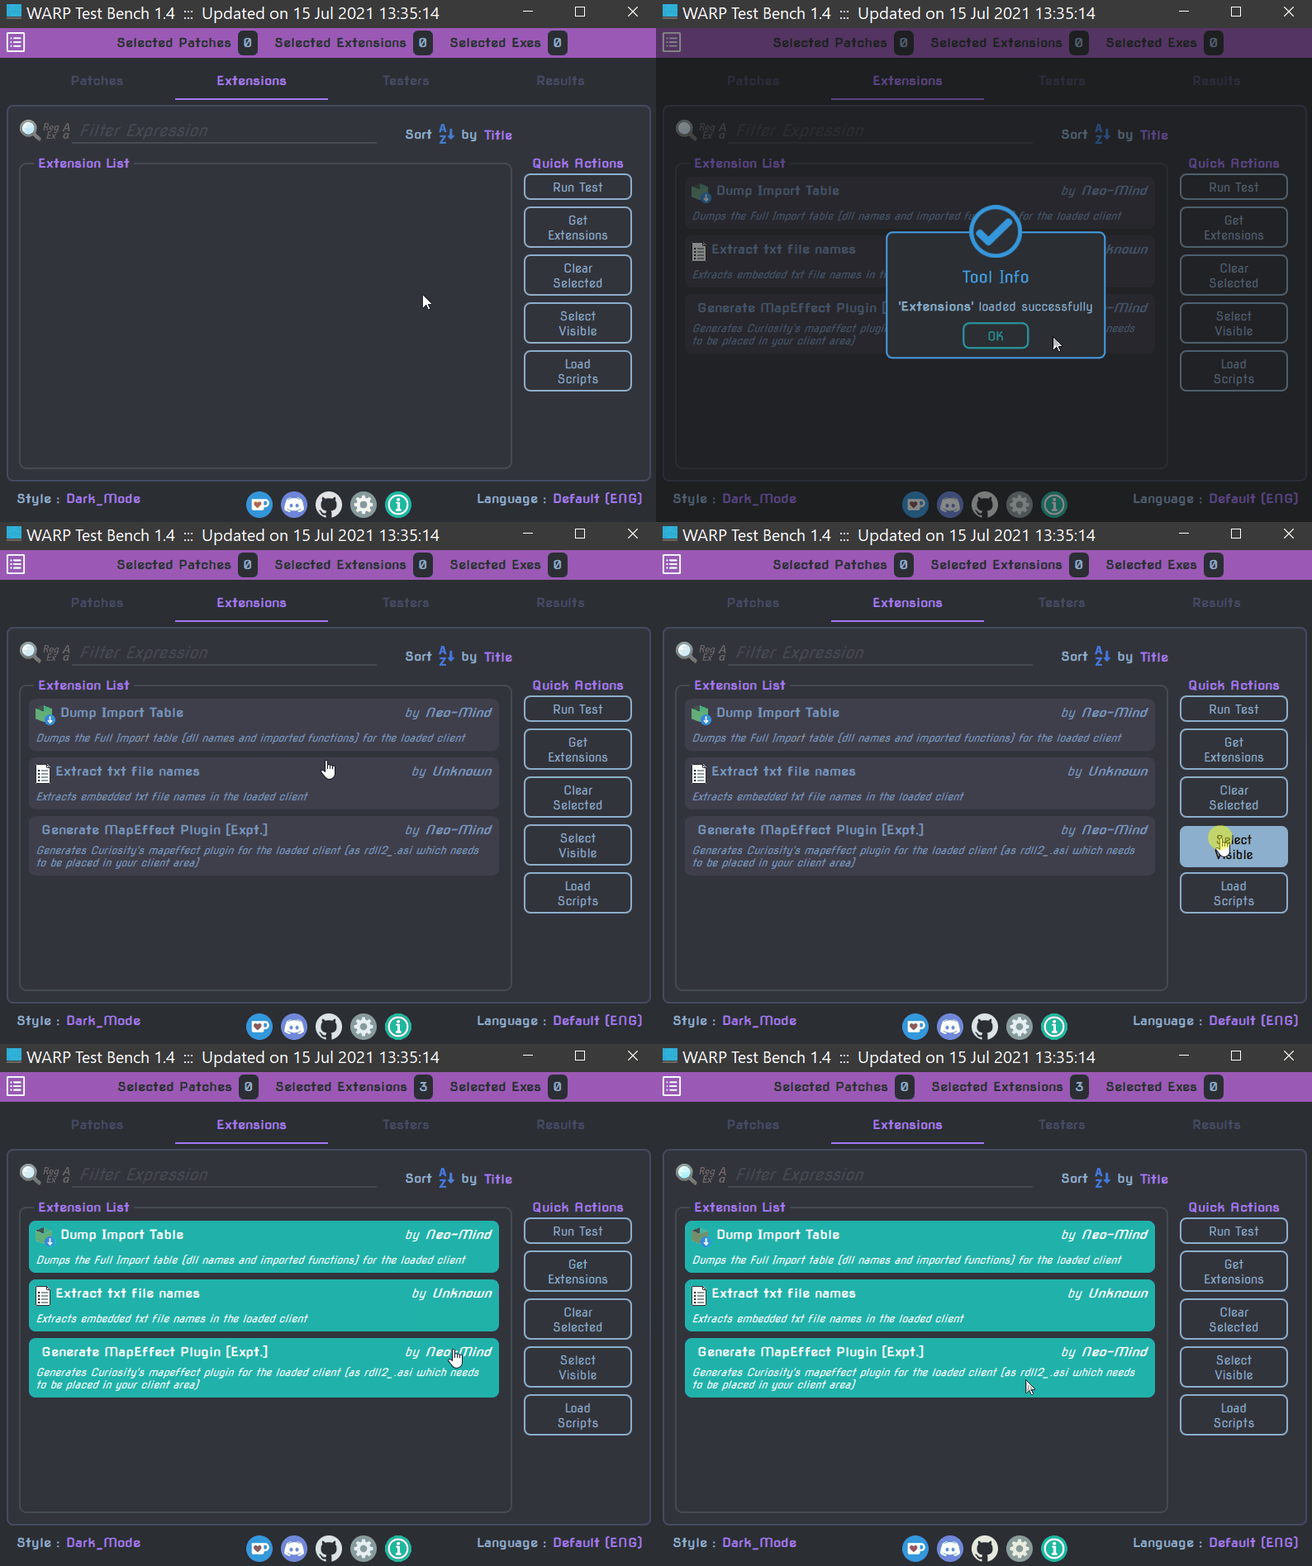
Quick Actions available:
-
Get ExtensionsPopulates the list of extensions from the definitions in 'Extensions.yml' file . See Extension Guide for more details.
-
Clear SelectedClears current selection of extensions.
-
Select VisibleSelect all visible extensions. Use the filter input to hide unnecessary extensions.
-
Load ScriptsLoad all changed/modified QJS scripts (since last time they were loaded) provided under 'Scripts' folder hierarchy (except for 'Init').
This tabs contains the list of apps on which we will test the Patches/Extensions.
As you can see we need to specify the Test Dir containing the apps to be tested first.
If you have already Run a Test before, then the Test Dir would be saved and setup again automatically.
You can also drag & drop the test directory on the Test Dir box to copy it's path.
One more alternative to specify both Test Dir and selecting the Exes in one go is to load them from a session file.
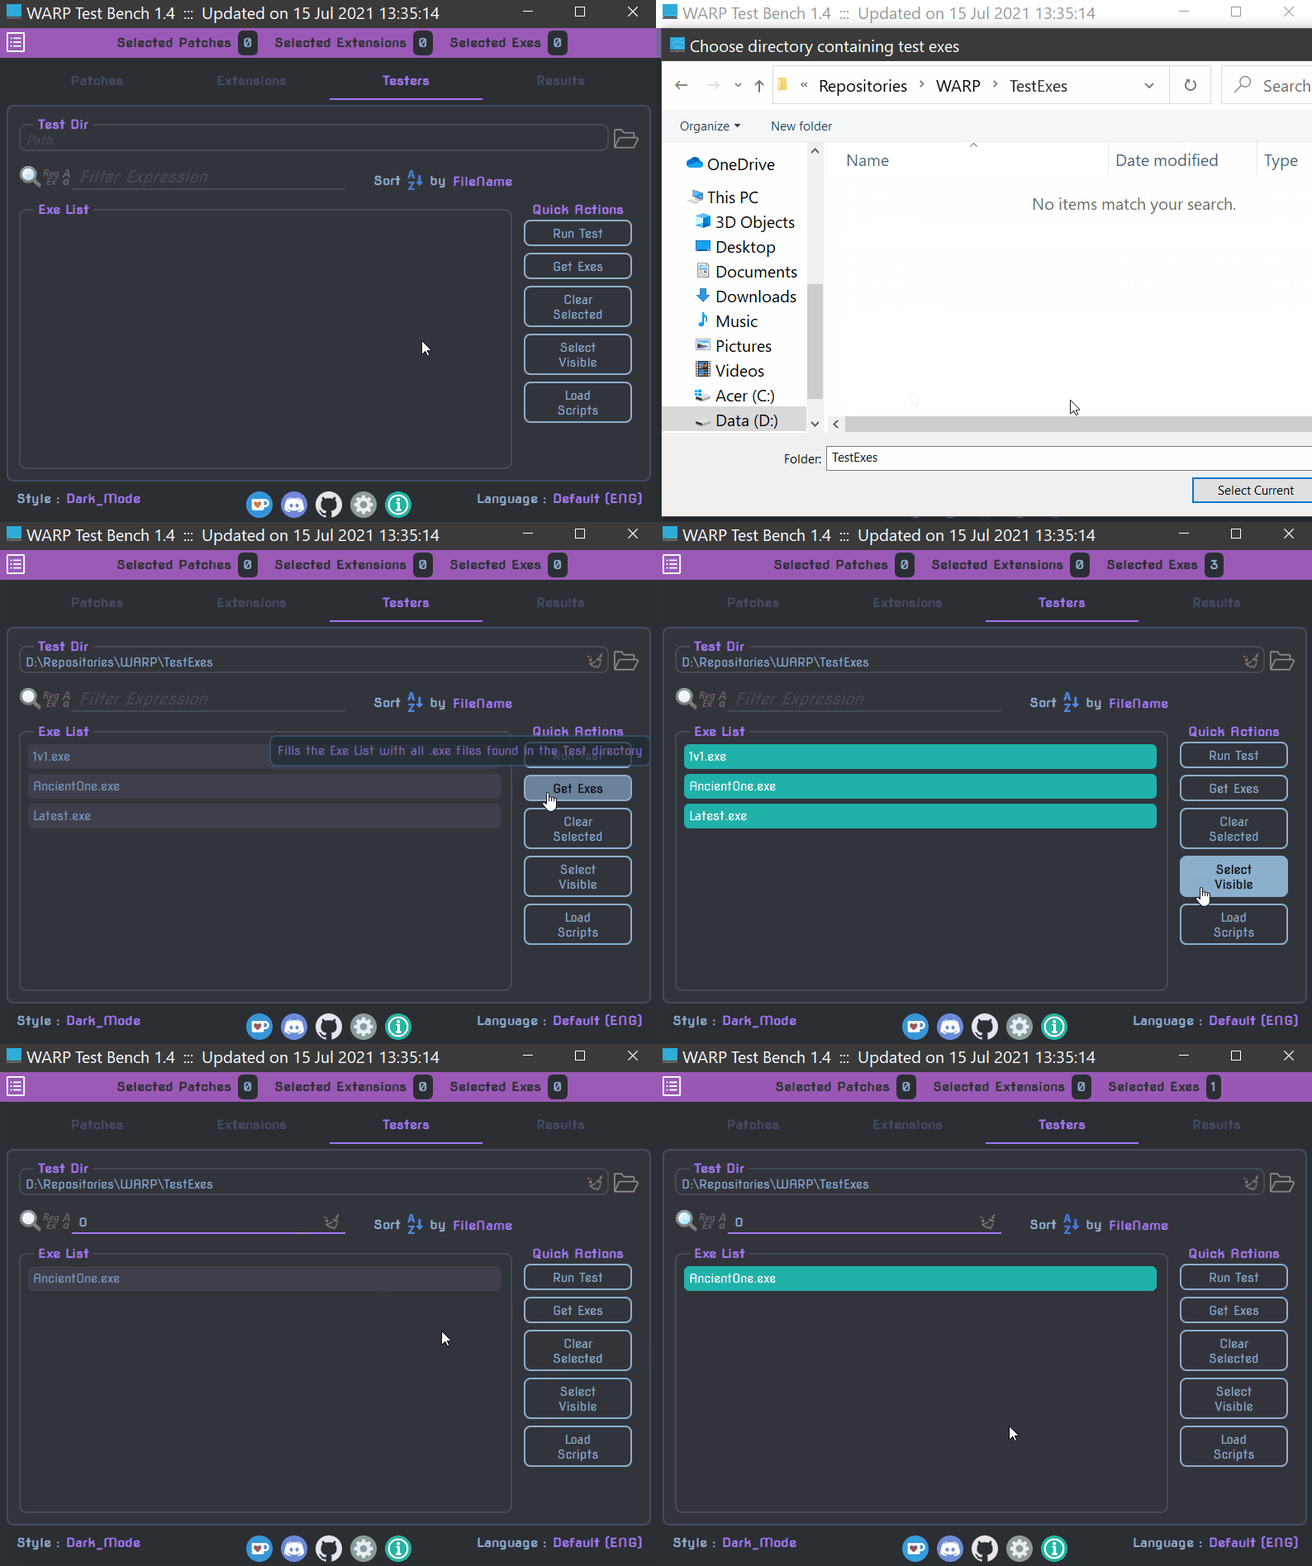
Quick Actions available:
-
Get ExesPopulates the list with exe (app) names from the Test Dir.
-
Clear SelectedClears current selection of apps.
-
Select VisibleSelect all visible app names. Use the filter input to hide unnecessary filenames.
-
Load ScriptsLoads all changed/modified QJS scripts (since last time they were loaded) provided under 'Scripts' folder hierarchy (except for 'Init').
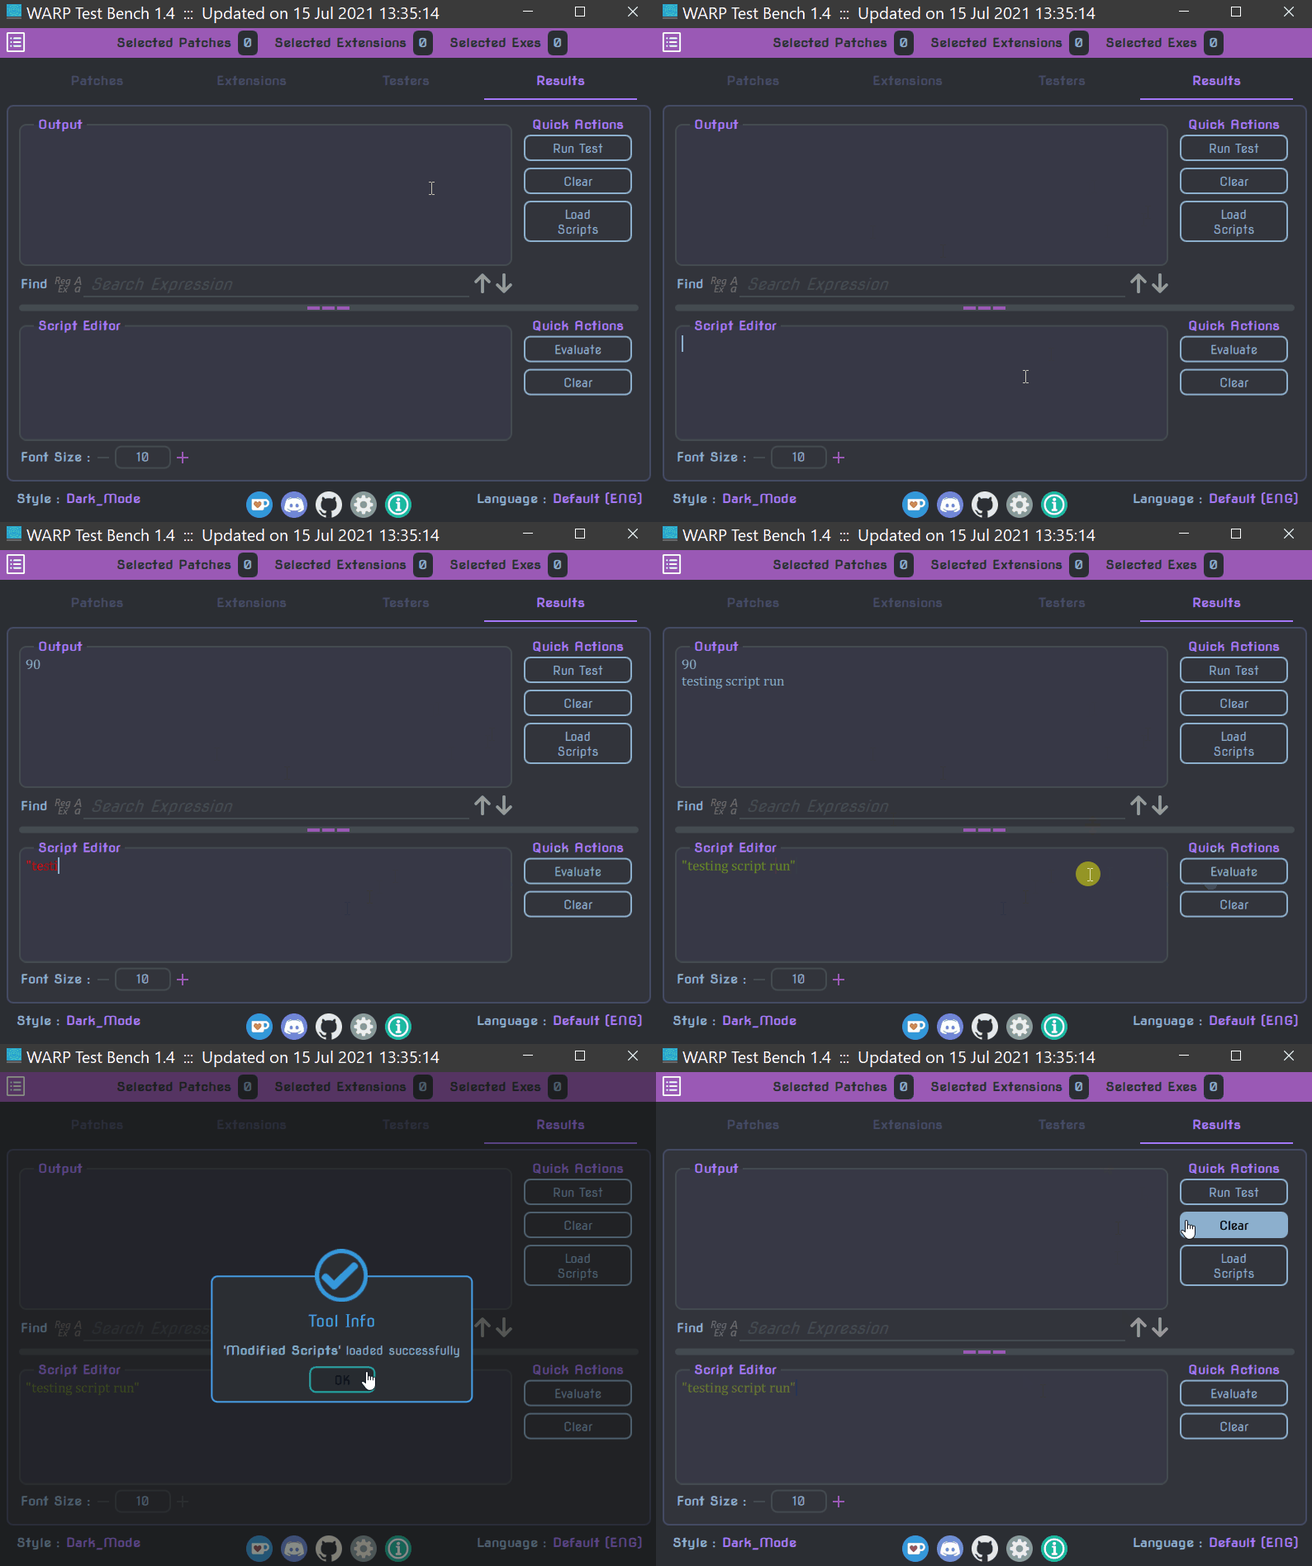
This tab contains the results of a test as well as a section for executing commands manually.
The 2 sections are vertically resizable (essentially same setup as the Script Window).
-
Output
-
The output frame will contain all the outputs, whether it is the results of the Run Test or the result of the Evaluate button below.
-
For test results, the reports are displayed with proper coloring (setup by the active Style) to distinguish between General Info, Warnings, Errors & any Debug messages.
-
To quickly access a specific line, please make use of the Find bar below the frame.
-
It has 3 Quick Actions available:
-
ClearCleans up the output frame.
-
Load ScriptsLoads all changed/modified QJS Scripts.
-
-
Script Editor
-
It works exactly the same way as the editor in Script Window and features the same options.
-
Used to interactively Evaluate QJS code manually.
-
One key difference here is that you get an additional function called Warp.LoadExe to load the appropriate tester app first.
-
It has 2 Quick Actions available:
-
EvaluateClick to evaluate the code present in the editor. Alternatively you can press
Ctrl+Ras well. -
ClearCleans up the editor.
-
-
Apart from the tabs there are 2 other parts of the UI to be discussed i.e. the Header & the Footer.
The header contains the button for the Action drawer and the selection count displays:
-
Selected PatchesShows the number of patches currently selected for testing.
-
Selected ExtensionsShows the number of extensions currently selected for testing.
-
Selected ExesShows the number of tester exe currently selected to be tested on.
Similar to the Main GUI, the Test Bench also has an Action drawer with mostly the same set of actions.
To open it you can either
-
Click the
 button OR
 -
Swipe rightwards from the left edge.

The available actions are
-
Scripts
-
Load from 'Patches'Load all QJS files provided in the 'Scripts/Patches' folder.
-
Load from 'Extensions'Load all QJS files provided in the 'Scripts/Extensions' folder.
-
Load from 'Support'Load all QJS files provided in the 'Scripts/Support' folder.
-
Load All ScriptsLoad all QJS files provided in the aforementioned 3 folders.
-
-
Refresh
-
Refresh LanguagesRefresh the list of languages provided via YAML files in the 'Languages' folder.
-
Refresh StylesRefresh the list of styles provided via YAML files in the 'Styles' folder.
-
-
Session
-
Load Session fileLoad a previously saved session YAML file. See Session file for more details.
You can also drag & drop the session file on top of the tool to load it directly.
-
Save Session fileSave the current session to a YAML file. See Session file for more details.
-
-
Patches
-
Select PreviousSelect Patches used in a previous session (available in 'LastSession.yml').
-
Select RecommendedSelect Patches marked as 'Recommended'.
-
The footer is essentially the same as in Main GUI. The only difference is in how the Settings dialog & About dialog look.
It has the following fields (going from left to right).
-
Style selectorSets the style i.e. Colors & Font (specified via YAML file) for the tool.
An inbuilt light style is available as default and a style file for Dark Mode has been provided as well.
See Style file for more details. Any changes are common to both GUIs and gets saved in 'Settings.yml'.
-
Ko-fi buttonIn case you are interested in supporting the project click this and it will open my Ko-fi page :)
-
Discord buttonOpens the invite link for WARP's discord server.
-
Github buttonOpens the Github page for WARP.
-
Settings buttonOpens the Settings dialog for the tool.
-
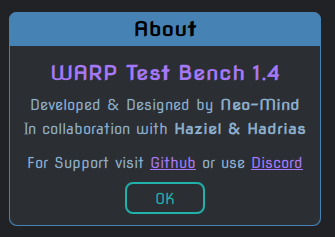
Info buttonOpens an About dialog with some info about the tool.
-
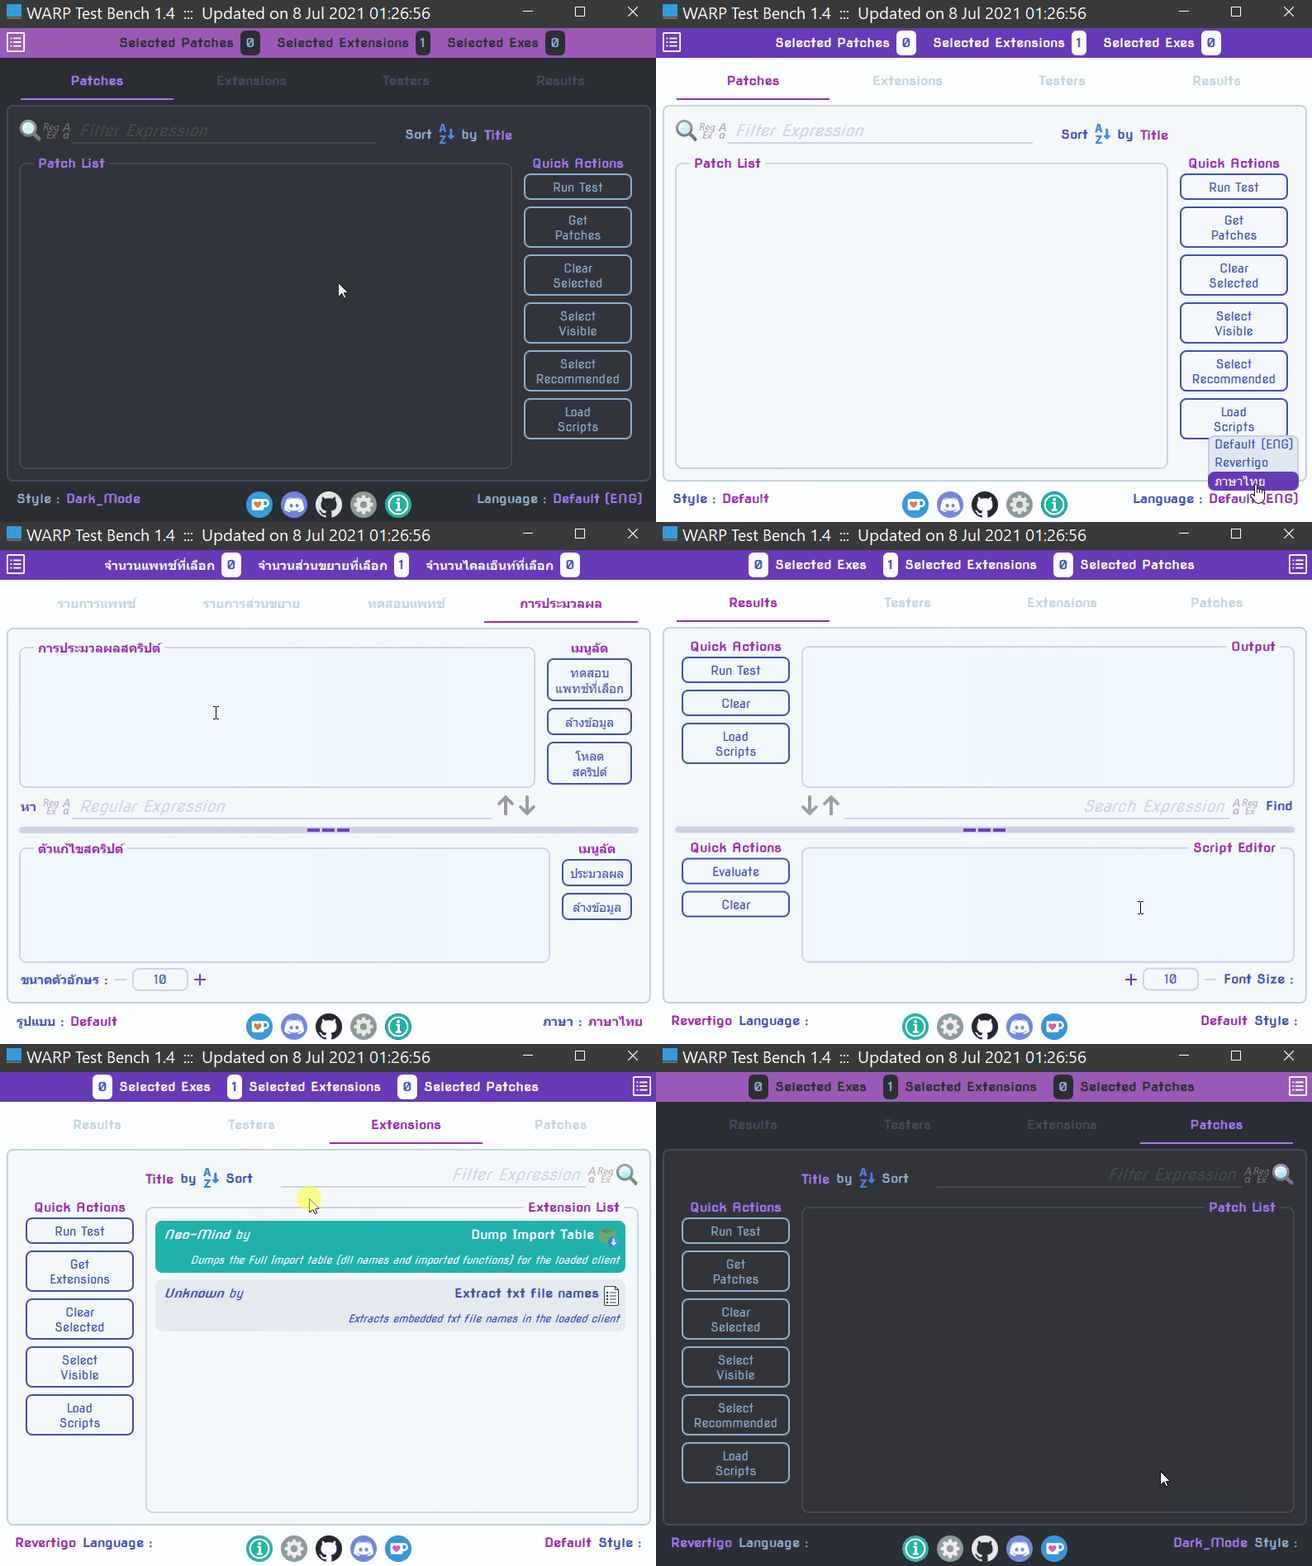
Language selectorSets the language (specified via YAML file) for the tool. English is provided in-built as a default.
See Language file for more details. Any changes are common to both GUIs and gets saved in 'Settings.yml'.
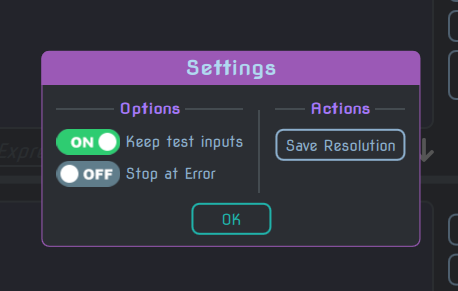
There are 2 options and 1 action available in the settings dialog as explained below.
-
Options
-
Keep test inputsIf ON, then the tool will keep the previously saved inputs for each succeeding test run.
-
Report Patch ModificationsIf ON, then the changes made by each patch will get reported whenever you do a test run.
The information will be added to both the Output frame as well as the log file if logging has started.
Keeping it ON can become sluggish after some amount of iterations, so use sparingly.
-
Show only errors & warningsIf ON, skips reporting successful patches/extensions and only the errors & warnings that comes up gets reported.
-
Stop at first errorIf ON then the tool will stop the test run at the first sight of an error.
-
Show lines with errorIf ON, then whenever the tool encounters an error the line where it occurred will also get reported (unless it is encrypted or messages are blocked)
-
-
Actions
-
Save ResolutionSaves the current resolution of the tool as default.
-
This is the common action across all the tabs (along with Load Scripts ofcourse).
It is used to run the test using the selected Patches and/or Extensions on the selected Tester apps.
If no tester is selected the tab automatically switches to 'Testers' tab.
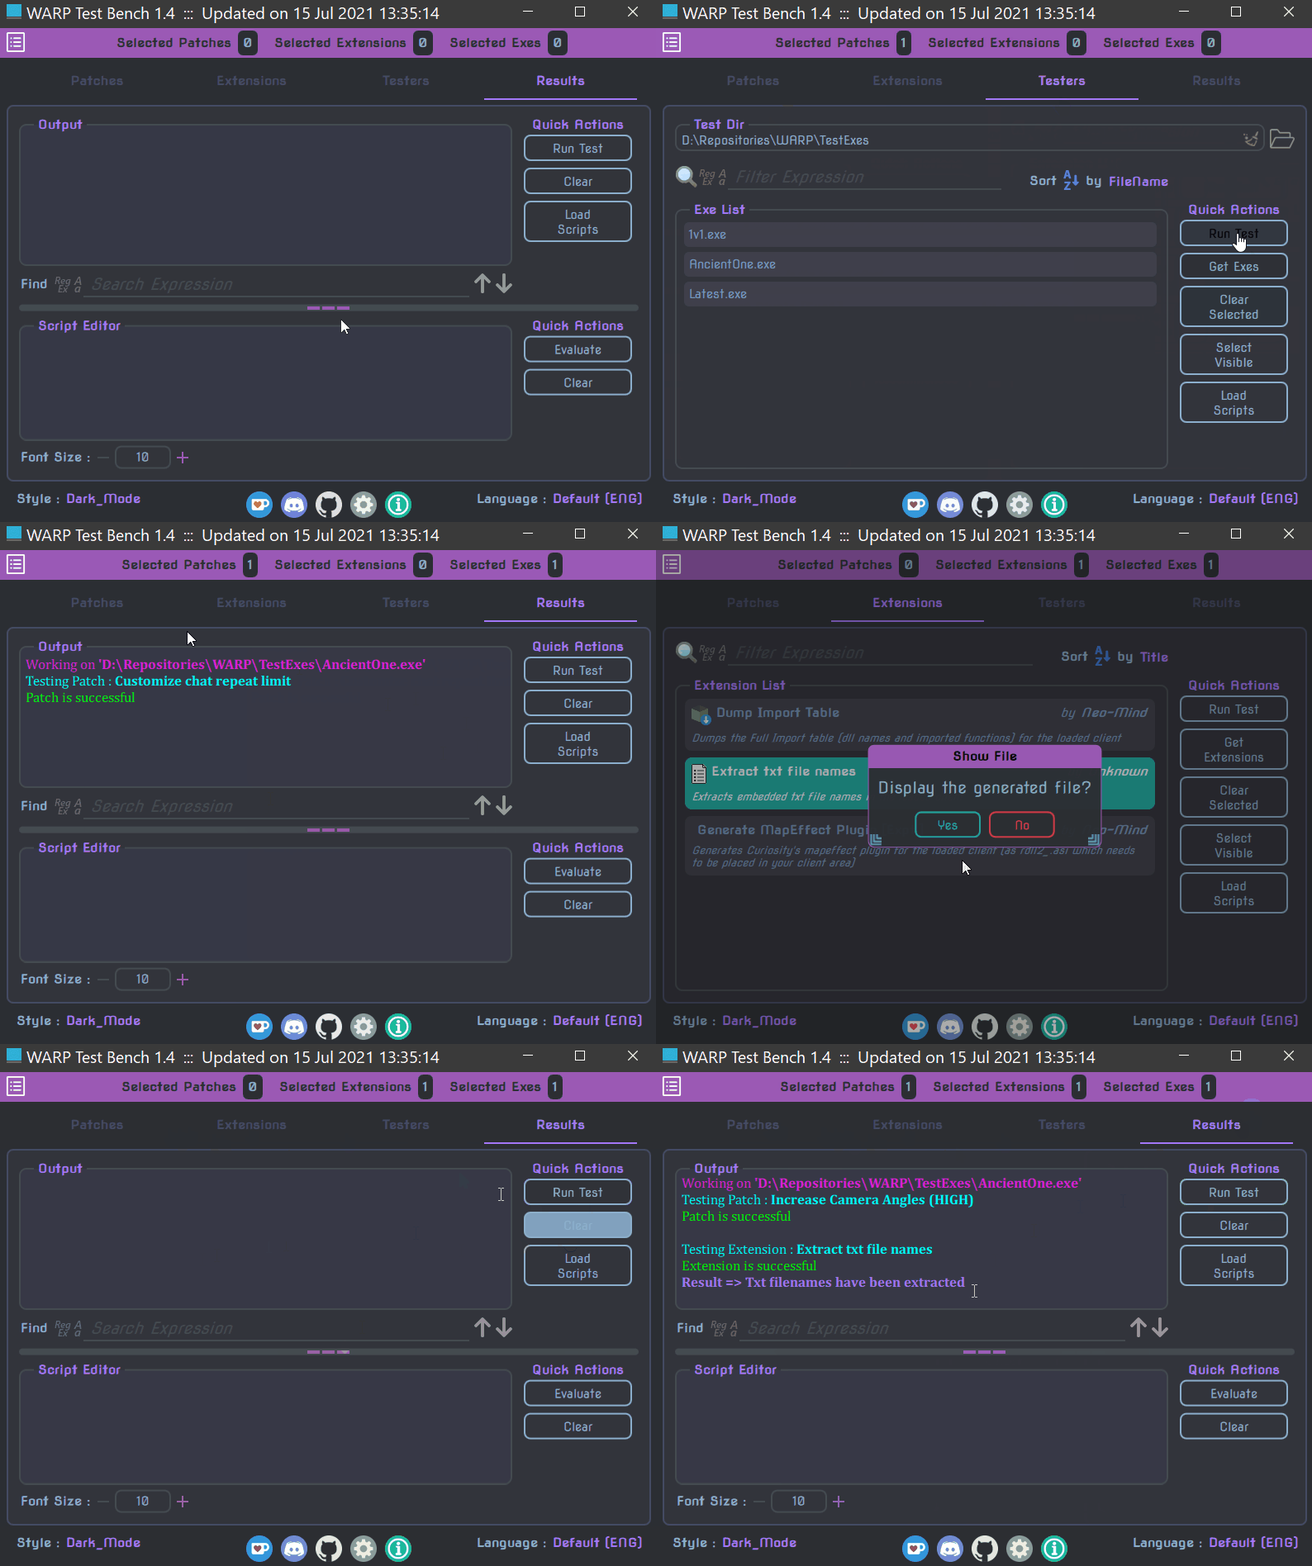
You can also press Ctrl+T to start a test.
Similarly if you wish to interrupt an ongoing run press Ctrl+Q.