Collecting Grafana Plugins Statistics as RedisTimeSeries and visualizing time series using Redis plugins for Grafana
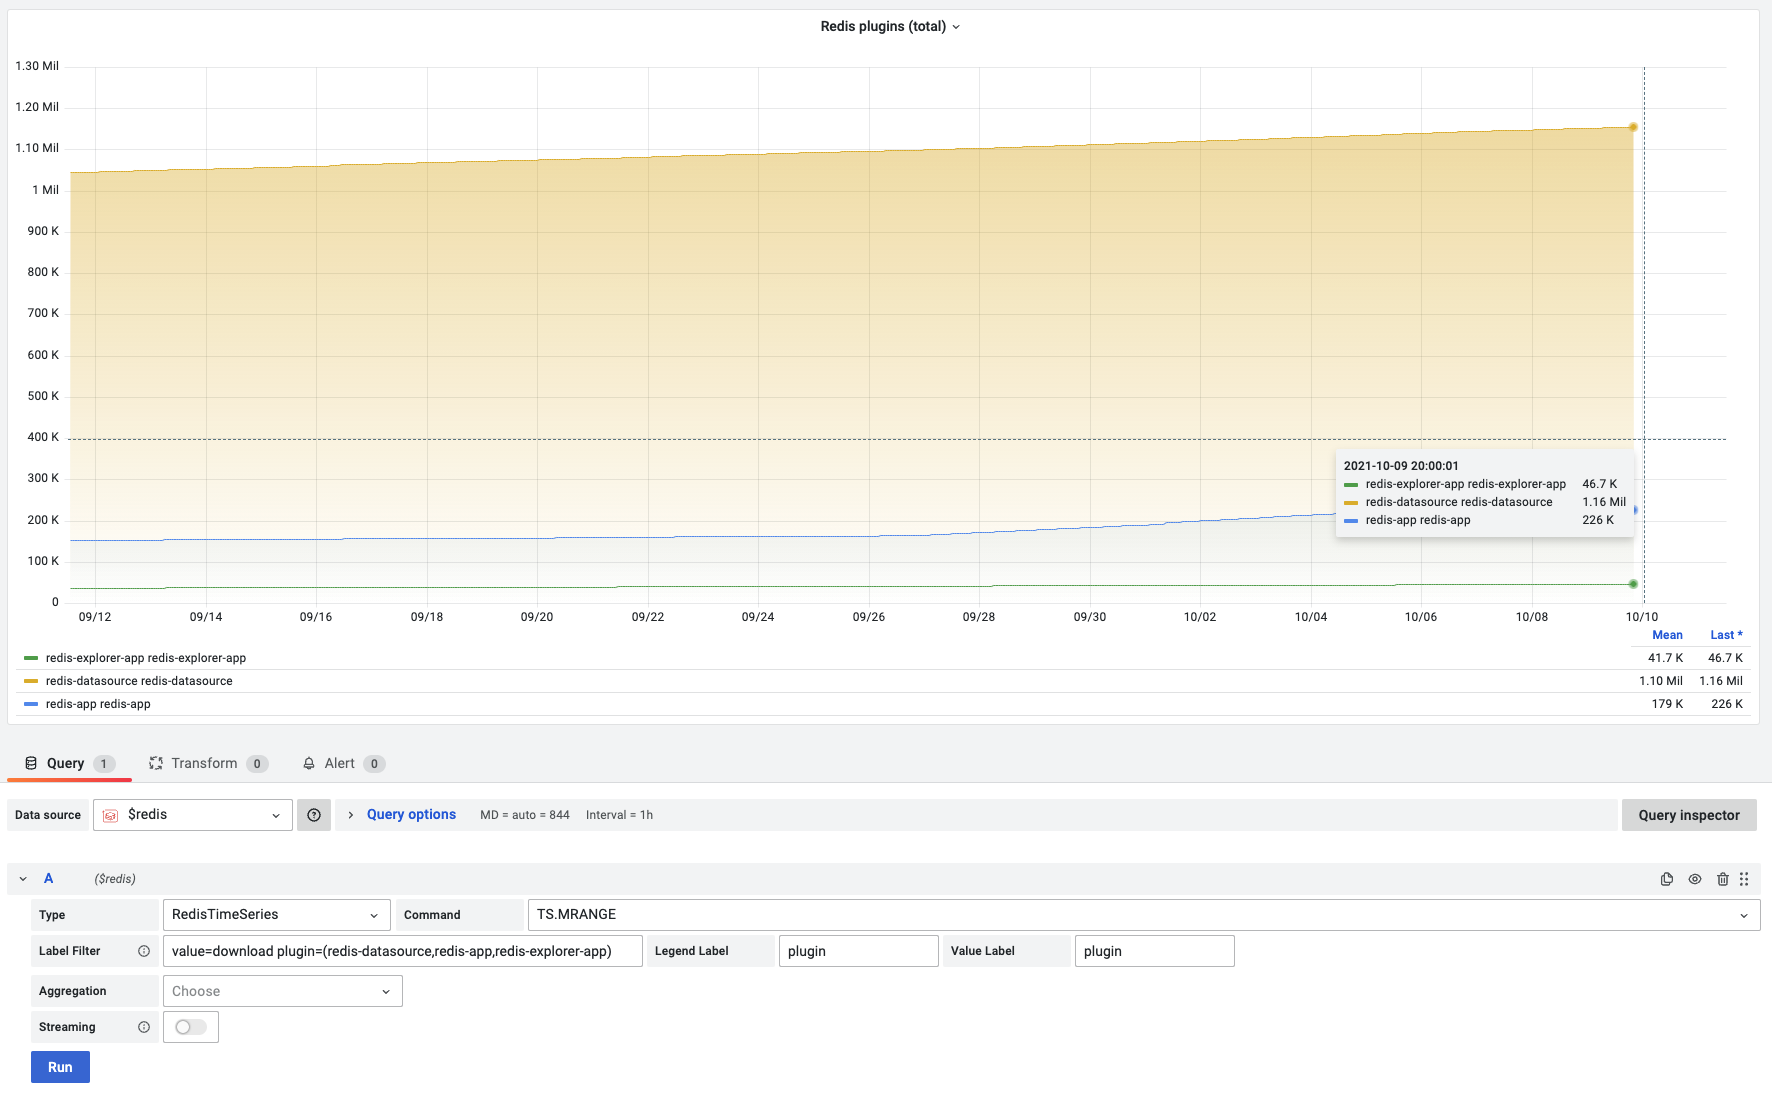
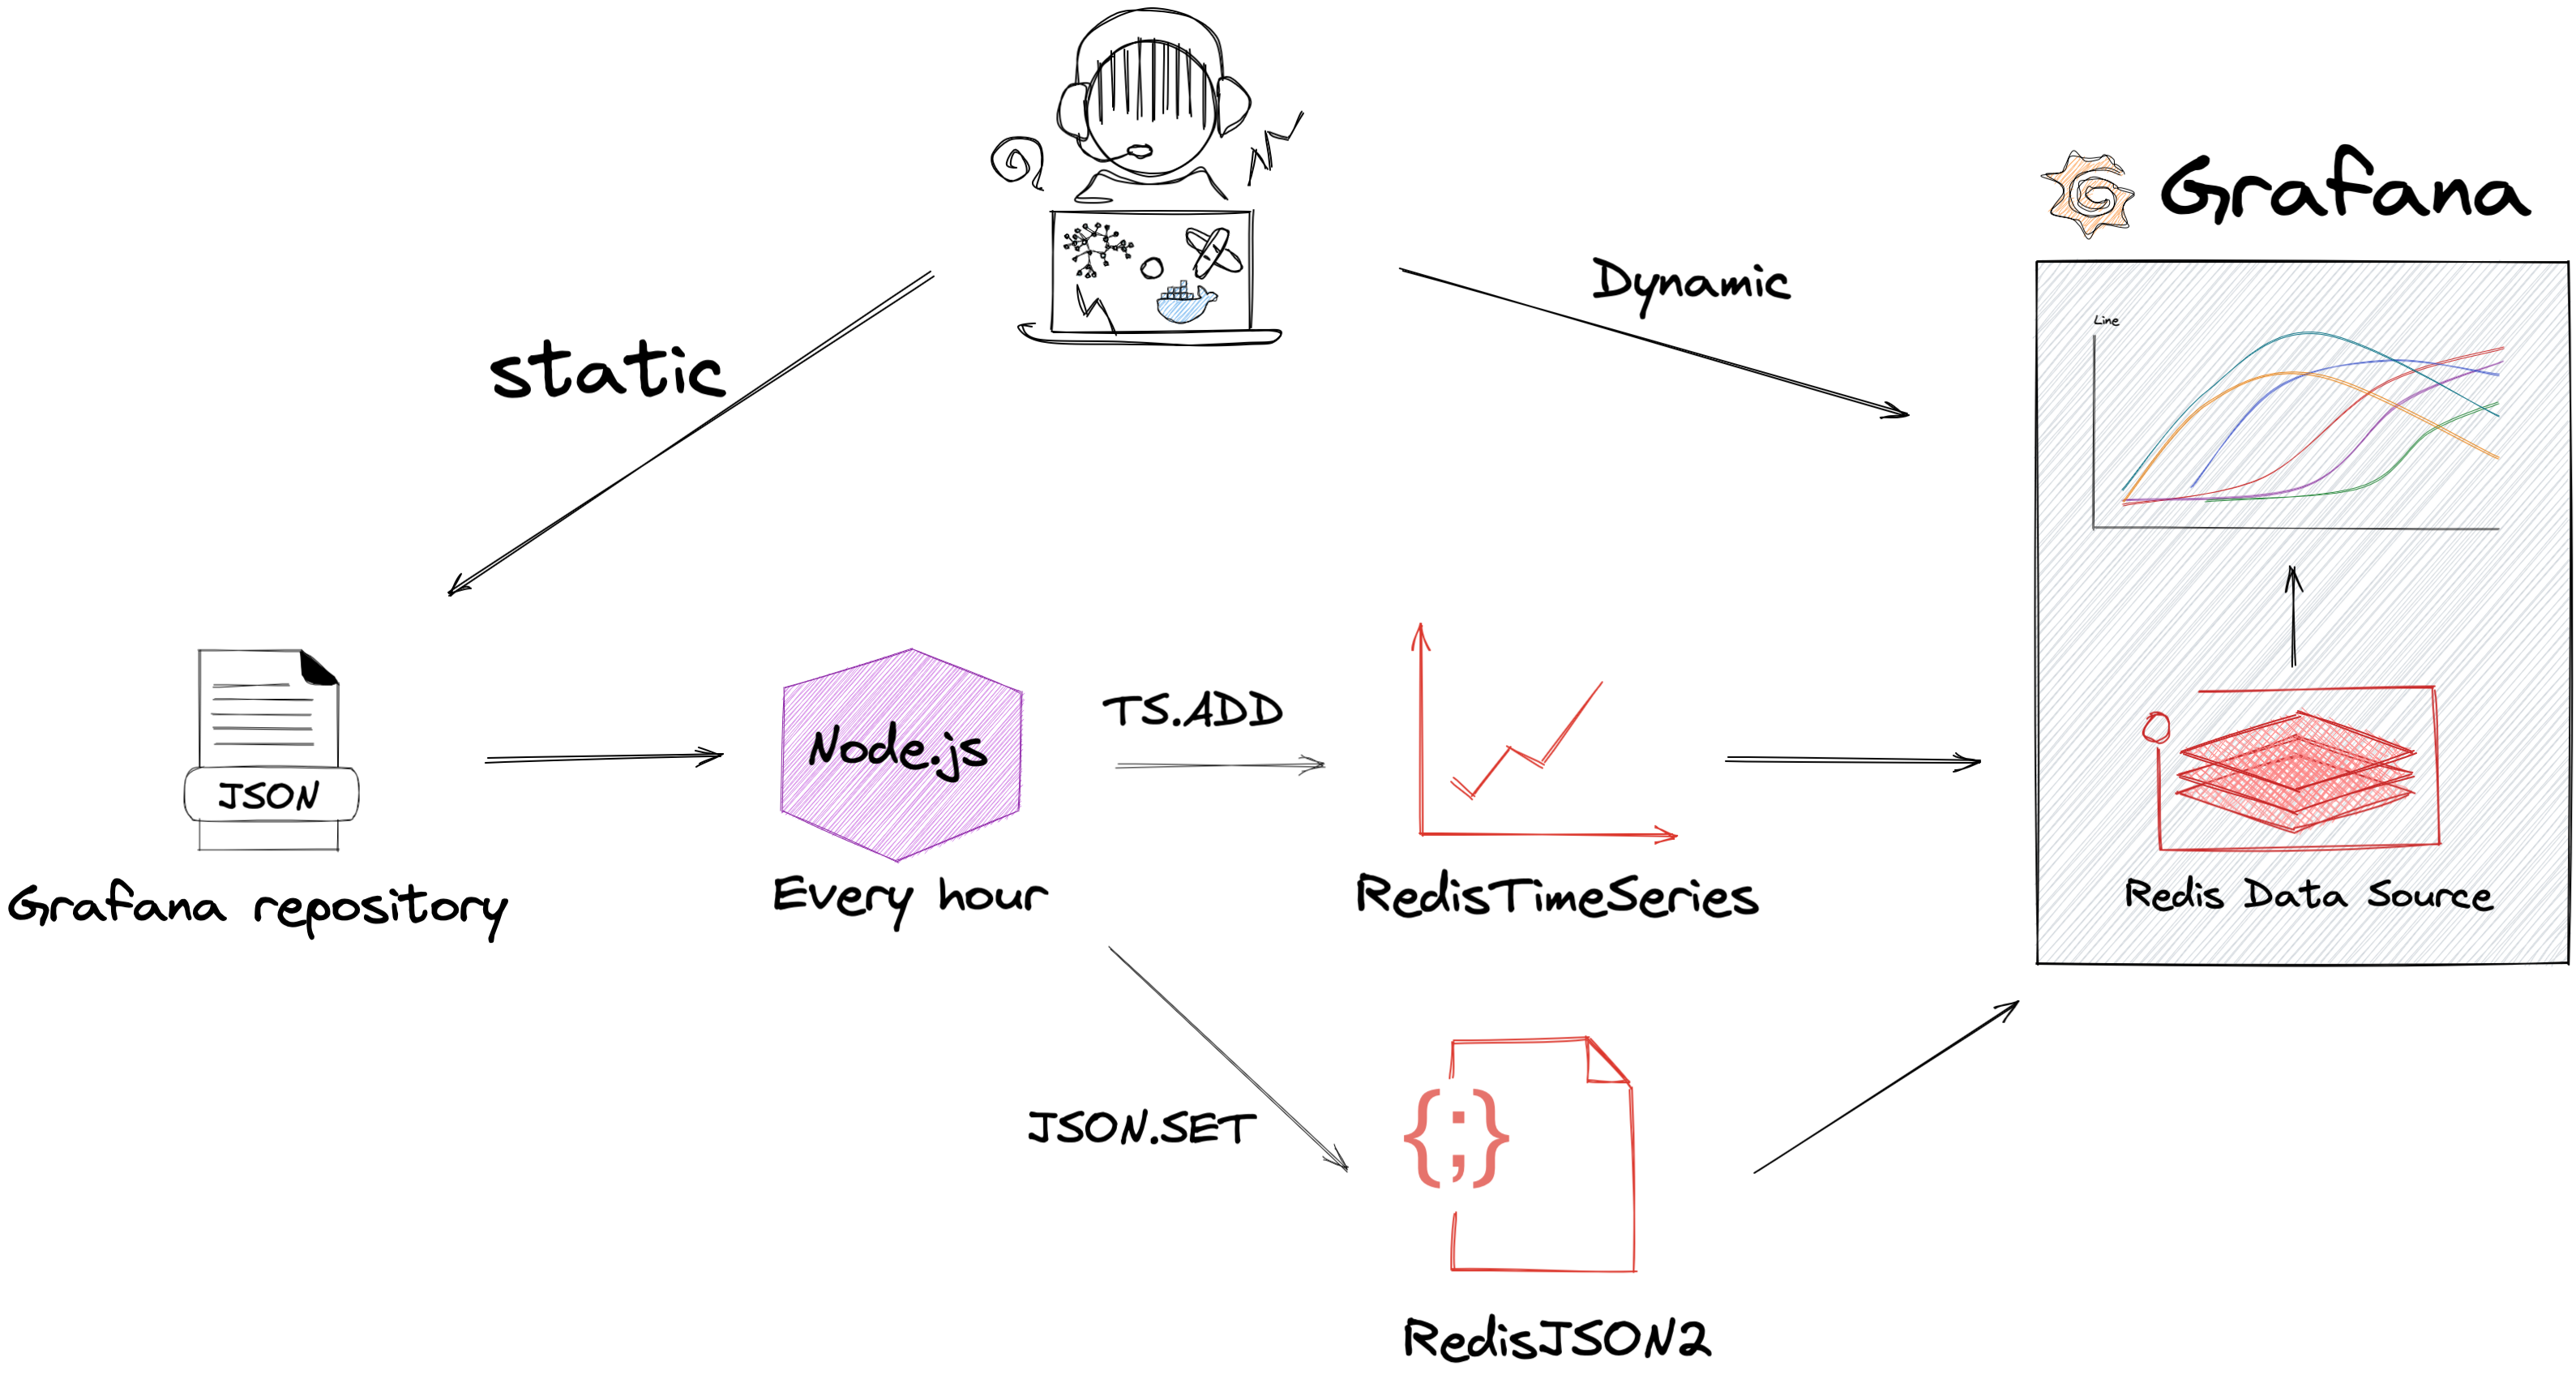
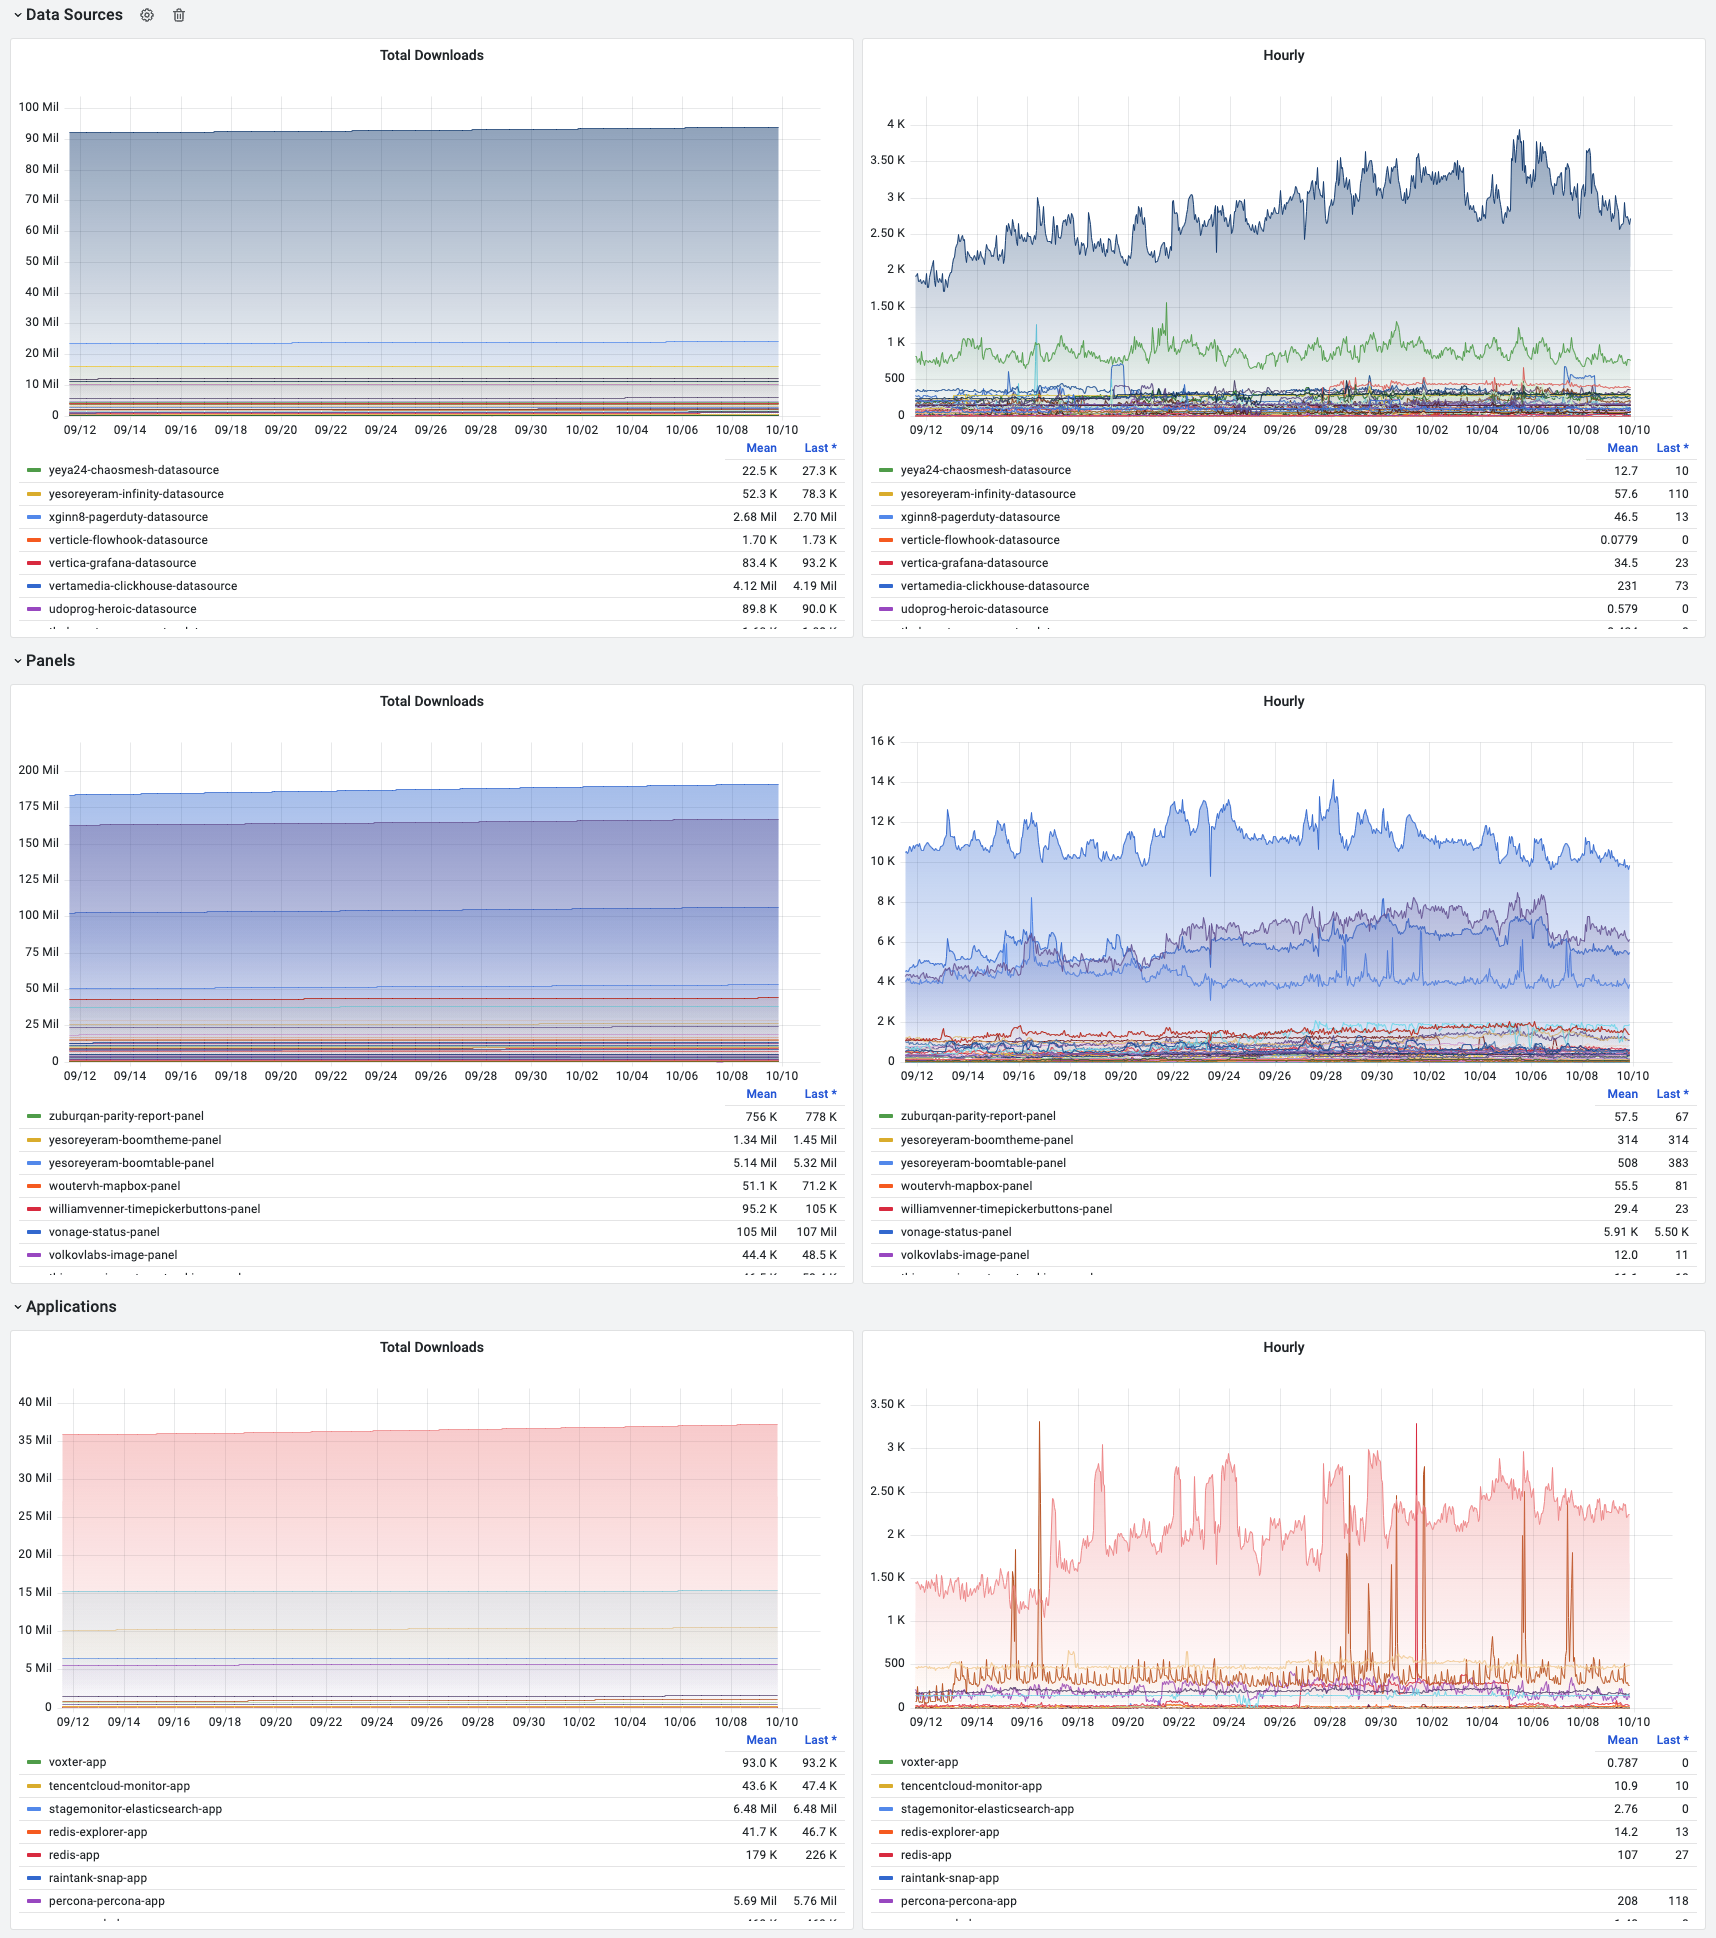
This project collects plugins statistics from Grafana repository as RedisTimeSeries and RedisJSON and visualizes collected data using Redis plugins for Grafana.
Read the full story on Redis Labs blog How to Use the New Redis Data Source for Grafana Plugin.
Demo is available on demo.volkovlabs.io:
This project provides Docker image with the latest version of Redis, RedisJSON2, RedisSearch2, RedisGraph and RedisGears modules.
docker run -p 6379:6379 --name=redis-jsg ghcr.io/redisgrafana/redis-jsg:latestCollect and store statistics for all Grafana plugins using RedisTimeSeries and RedisJSON modules.
node src/stats.tsRediSearch does not support JSON array, which means that JSON with all plugins should be separated to individial JSON keys and the easiest way to do it is using RedisGears.
import json


def update(x):
    """
    Update plugins
    """
    j = json.loads(execute('json.get', x['key'], '.items'))
    for i in j:
        execute('SADD', 'set:plugins', i['slug'])
        execute("JSON.SET", "plugin:" + i['slug'], ".", json.dumps(i))


gb = GearsBuilder('KeysReader')
gb.map(update)
gb.register(prefix='plugins')
This RedisGears script automatically parse and updates indivial plugins keys when plugins key updated every hour.
To create RediSearch schema:
FT.CREATE pluginIdx ON JSON SCHEMA $.name AS name TEXT $.description AS description TEXT
To visualize the collected data start Docker containers:
docker-compose up- Redis plugins for Grafana Documentation
- Elevate your Redis experience with Redis plugins for Grafana
- Real-time observability with Redis and Grafana
- Fork the repository.
- Find an issue to work on and submit a pull request.
- Could not find an issue? Look for documentation, bugs, typos, and missing features.
- Apache License Version 2.0, see LICENSE.


