使用示例见example.ipynb,示例图见文件夹example_figures(更新比较勤)
一个用于认知神经领域科研绘图的python包,并且可以完成简单的统计检验并自动标星号。
主要包括5种图:
- 单组bar图
- 矩阵图
- 单组小提琴图
- 点线相关图
- 脑图
- 人类Glasser脑区图
- 猕猴CHARM5脑区图
- 圈状图(circos图)
- 对称
- 不对称
前5种图基于matplotlib进行绘图,scipy进行统计检验。人上的脑图基于neuromaps、surfplot完成,猴上的脑图基于mne完成。
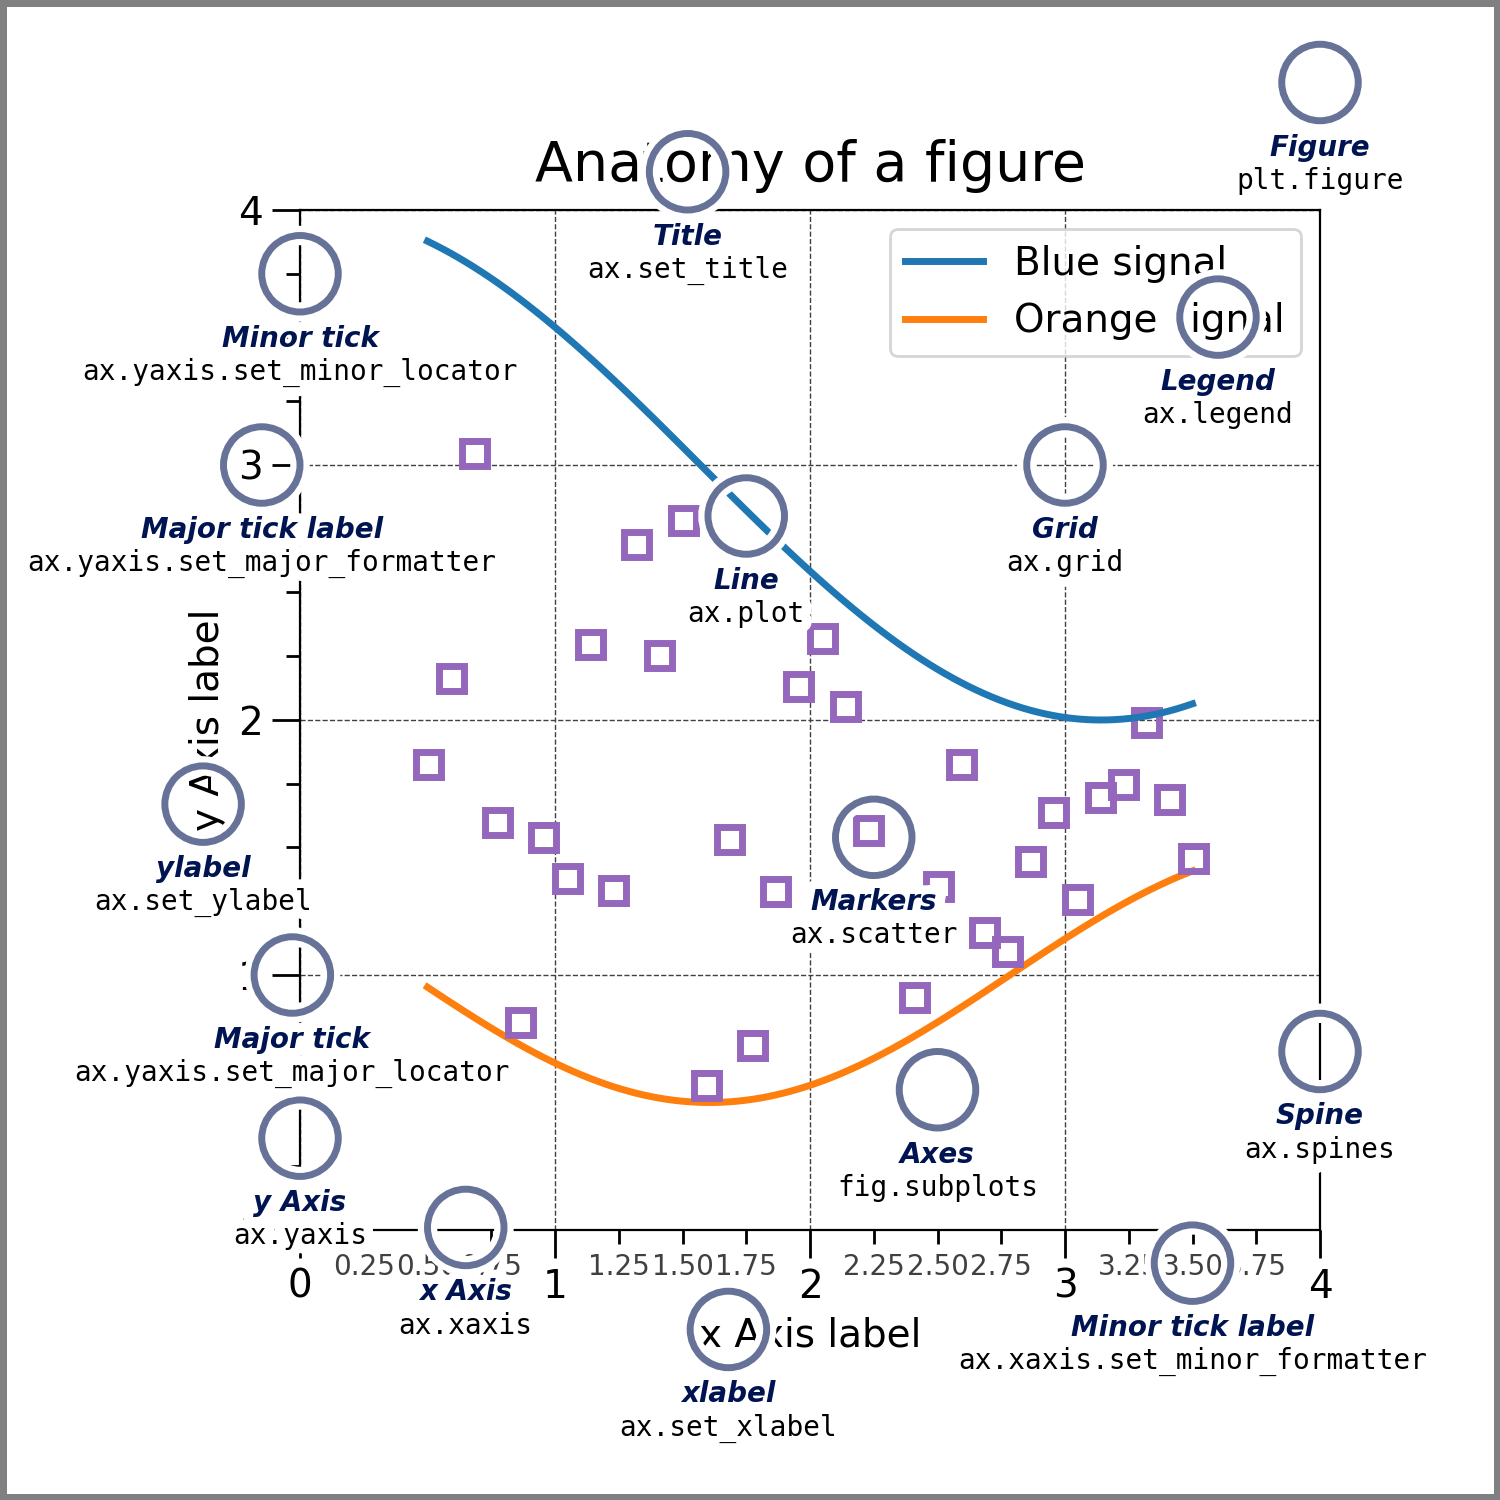
基本知识,一张图中的基本元素的名字:

提问:fig,ax,ylabel,xlabel,xtick,legend是什么?
使用前需安装:
numpy# 数据处理pandas# 文件读取matplotlib# 绘图statsmodels# 统计分析scipy# 统计分析mne-connectivity# 圈状图(circos图)绘制mne# 脑图绘制**(这个包的安装比较麻烦,见下文)**neuromaps# 脑图绘制surfplot# 脑图绘制
安装包均可以使用:
pip install <package_name> -i https://pypi.tuna.tsinghua.edu.cn/simple如果你不需要绘制猕猴CHARM5脑区图,可以无视MNE的安装,没必要折腾自己。
如果你需要绘制猕猴CHARM5脑区图,则会用到MNE包,一般情况下只需要:
pip install mne -i https://pypi.tuna.tsinghua.edu.cn/simple # 安装MNE包即可如果安装完成后依旧报错,原因有很多,根据经验(一条条尝试,直到不报错为止):
- 安装
pyvistaqt、ipywidgets以及qdarkstyle包; - 安装
mne的时候,除了pip install mne,还可以尝试pip install mne-base; import vtk是否报错,如果报错,则卸载重新pip install vtk==9.3.0。
import numpy as np
import matplotlib.pyplot as plt
from Plot_figure.plot_figure import *  # 从Plot_figure文件夹中的plot_figure.py文件中导入所有函数


# 出于演示目的,随机生成3组数据
np.random.seed(0)
Human = np.random.normal(1000,100,30)
Macaque = np.random.normal(1500,100,30)
Chimpanzee = np.random.normal(2000,100,30)
# 导入数据
data = [Human, Macaque, Chimpanzee]
labels_name = ['H', 'M', 'C']
colors = ['#c44e52','#bcbbc0', '#1a1a1a']  # 自定义颜色(十六进制)
# 设置figure
fig, axes = plt.subplots(2, 2, figsize=(8,8))  # 2行2列,共4个子图
fig.subplots_adjust(wspace=0.3, hspace=0.3)  # 设置子图间间距
# 设置axes
ax1 = axes[0][0]  # 第1行,第1列子图
ax2 = axes[0][1]  # 第1行,第2列子图
ax3 = axes[1][0]  # 第2行,第1列子图
ax4 = axes[1][1]  # 第2行,第2列子图
# 调用函数
## 第1张ax
plot_one_group_bar_figure(data, ax=ax1, colors=colors)
## 第2张ax
plot_one_group_bar_figure(data, ax=ax2, width=0.8, labels_name=labels_name, colors=colors, math_text=False, x_tick_rotation=30, x_label_ha='right', statistic=True)
## 第3张ax
plot_one_group_bar_figure(data, ax=ax3, labels_name=labels_name, colors=colors, math_text=False, percentage=True, statistic=True, test_method='permutation_median')
## 第4张ax
plot_one_group_bar_figure(data, ax=ax4, labels_name=labels_name, colors=colors, ax_min_is_0=True, statistic=True, test_method='ttest_rel')
# 保存图片
fig.savefig("./figures/single_bar.png", dpi=250, bbox_inches='tight') # 保存到指定位置,以及设置图片清晰度(越清晰,图片越大),矢量图保存可以换成.svg格式函数名字:plot_one_group_bar_figure
参数(大部分参数都有默认值,如无需要,不需更改):
-
data: 输入的数据;列表 -
ax: 子图 -
labels_name: 横坐标上每一个bar的名字,上例中的“H, M, C”;列表 -
x_tick_fontsize: 横坐标上每一个bar的名字字体大小;数值 -
x_tick_rotation: 横坐标上每一个bar的名字旋转角度;数值 -
x_label_ha: 横坐标上每一个bar的名字旋转的中心位置;'center'/'left'/'right'(以“center和right”为最常用) -
width: bar的宽度;数值 -
colors: 每个bar的颜色;列表 -
title_name: 子图标题;字符串 -
title_fontsize: 子图标题字体大小;数值 -
title_pad: 子图标题与子图间距;间距 -
x_label_name: x轴标题;字符串 -
x_label_fontsize: x轴标题字体大小;数值 -
y_label_name: y轴标题;字符串 -
y_label_fontsize: y轴标题字体大小;数值 -
y_tick_fontsize: y轴tick字体大小;数值 -
y_tick_rotation: y轴tick字体旋转角度;数值 -
y_max_tick_to_one: y轴最大值是否设置为1;True/False(在特殊场景下,y>1没有意义时可以使用,例如相关性系数) -
y_max_tick_to_value: 配合上个参数使用;数值(在特殊场景下,y>“某个数”没有意义时可以使用,使y轴不显示大于该数的值) -
y_lim_range: y轴最大值和最小值;列表(默认为None,手动设置,例如[0,10],则指定y轴上只显示0~10的数据) -
math_text: y轴是否采用科学计数法显示;True/False -
one_decimal_place: y轴是否保留1位小数;True/False -
percentage: y轴是否采用百分数显示;True/False -
ax_min_is_0: y轴最小值是否为0;True/False(在特殊场景下,y<0没有意义时可以使用,例如脑体积大小) -
statistic: 是否需要进行统计检验;True/False(在已有统计方法不适用的情况下,可以禁用自动统计,后续手动统计、标星号) -
asterisk_fontsize: 星号大小;数值 -
multicorrect: 是否多重比较校正;True/False -
test_method: 统计方法;'ttese_ind 独立样本t检验'/'ttest_rel 配对样本t检验'/'mannwhitneyu 非参数检验'/'permutation_mean Permutation检验(mean值)'/'permutation_median Permutation检验(median值)'
统计检验方法,目前仅包括:
- 独立样本t检验,双尾
- 配对样本t检验,双尾
- Mann Whitney U 非参数检验,双尾
- permutation检验,双尾,采样数10000
- mean
- median
多重比较校正为Bonferroni校正,及将p值乘以比较次数。
import numpy as np
import matplotlib.pyplot as plt
from Plot_figure.plot_figure import *  # 从Plot_figure文件夹中的plot_figure.py文件中导入所有函数

# 出于演示目的,随机生成3组数据
np.random.seed(1998)
Human = np.random.normal(1000,100,100)
Random = np.random.normal(1500,100,100)
Macaque = np.random.normal(2000,100,100)
# 导入数据
data=[Human, Random, Macaque]
labels_name = ['Human', 'Random', 'Macaque']
colors=['#c44e52','#bcbbc0', '#1a1a1a']
# 设置figure
fig = plt.figure(figsize=(8,8))
plt.subplots_adjust(wspace=0.3, hspace=0.3)
# 设置axes
ax1 = fig.add_subplot(221)
ax2 = fig.add_subplot(222)
ax3 = fig.add_subplot(223)
ax4 = fig.add_subplot(224)
# 调用函数
## 第1张ax
plot_one_group_violin_figure(data, ax=ax1, colors=colors, statistic=True)
## 第2张ax
plot_one_group_violin_figure(data, ax=ax2, labels_name=labels_name, colors=colors, math_text=False, one_decimal_place=True, x_tick_rotation=30, x_label_ha='right', statistic=True,  test_method='permutation_mean')
## 第3张ax
plot_one_group_violin_figure(data, ax=ax3, labels_name=labels_name, colors=colors, math_text=False, percentage=True, statistic=True, test_method='ttest_rel')
## 第4张ax
plot_one_group_violin_figure(data, ax=ax4, labels_name=labels_name, colors=colors, y_lim_range=[-1000, 3000])
# 保存图片
fig.savefig("./figures/single_violin.png", dpi=250, bbox_inches='tight')函数名字:plot_one_group_violin_figure
参数,与[1.2 函数介绍](# 1.2 函数介绍)相同
与[1.3 关于统计检验](# 1.3 关于统计检验)相同
import numpy as np
import matplotlib.pyplot as plt
from Plot_figure.plot_figure import *  # 从Plot_figure文件夹中的plot_figure.py文件中导入所有函数

# 出于演示目的,生成随机数据
np.random.seed(0)
rm_rjx1 = np.random.normal(0, 1, 100)
rm_rjx2 = 2 * rm_rjx1 + np.random.normal(0, 1, 100)
# 设置figure
fig = plt.figure(figsize=(3, 3))
# 设置axes
ax = fig.add_subplot(111)
# 调用函数
plot_correlation_figure(rm_rjx1, rm_rjx2, stats_method='spearman', summary=True)
# 保存图片
fig.savefig(r"./figures/correlation.png",dpi=250, bbox_inches='tight') # 保存到指定位置,以及设置图片清晰度(越清晰,图片越大),矢量图保存可以换成.svg格式函数名字:plot_correlation_figure
参数(大部分参数都有默认值,如无需要,不需更改):
-
data1: x轴数据;列表 -
data2: y轴数据;列表 -
ax: 子图 -
stats_method: Pearson相关还是Spearman相关;'pearson'/'spearman' -
dots_color: 点的颜色;十六进制颜色 -
line_color: 线的颜色;十六进制颜色 -
title_name: 子图标题;字符串 -
title_fontsize: 子图标题字体大小;数值 -
title_pad: 子图标题与子图间距;间距 -
x_label_name: x轴标题;字符串 -
x_label_fontsize: x轴标题字体大小;数值 -
x_tick_fontsize: x轴tick字体大小;数值 -
x_tick_rotation: x轴tick字体旋转角度;数值 -
x_major_locator: x轴各个tick之间的距离;数值 -
x_max_tick_to_one: x轴最大值是否设置为1;True/False(在特殊场景下,x>1没有意义时可以使用,例如相关性系数) -
x_max_tick_to_value: 配合上个参数使用;数值(在特殊场景下,x>“某个数”没有意义时可以使用,使y轴不显示大于该数的值) -
x_math_text: x轴是否采用科学计数法显示;True/False -
x_one_decimal_place: x轴是否保留1位小数;True/False -
x_percentage: x轴是否采用百分数显示;True/False -
y_label_name: y轴标题;字符串 -
y_label_fontsize: y轴标题字体大小;数值 -
y_tick_fontsize: y轴tick字体大小;数值 -
y_tick_rotation: y轴tick字体旋转角度;数值 -
y_major_locator: y轴各个tick之间的距离;数值 -
y_max_tick_to_one: y轴最大值是否设置为1;True/False(在特殊场景下,y>1没有意义时可以使用,例如相关性系数) -
y_max_tick_to_value: 配合上个参数使用;数值(在特殊场景下,y>“某个数”没有意义时可以使用,使y轴不显示大于该数的值) -
y_math_text: y轴是否采用科学计数法显示;True/False -
y_one_decimal_place: y轴是否保留1位小数;True/False -
y_percentage: y轴是否采用百分数显示;True/False -
asterisk_fontsize: 星号大小;数值 -
summary: 总结线性模型拟合结果;True/False
import numpy as np
import matplotlib.pyplot as plt
from Plot_figure.plot_figure import *  # 从Plot_figure文件夹中的plot_figure.py文件中导入所有函数

# 数据
np.random.seed(1998)
data1 = np.random.random((88,88))
data2 = np.random.random((88,88))
labels = ['area_32','area_25','area_24a/b','area_24c','area_24a/b_prime','area_24c_prime','area_10','area_14','area_11','area_13','area_12m/o','Iam/Iapm','lat_Ia','OLF','G','PrCO','area_8A','area_8B','area_9','area_46d','area_46v/f','area_12r/l','area_45','area_44','M1','PMd','PMv','preSMA','SMA','area_3a/b','areas_1-2','SII','V6','V6A','area_5d','PEa','MIP','fundus_IPS','AIP','LIP','LOP','MST','area_7a/b','area_7op','area_7m','area_31','area_23','area_v23','area_29','area_30','TF/TFO','TH','caudal_ERh','mid_ERh','rostral_ERh','area_35','area_36','TGa','TGd','TGg','TEO','post_TE','ant_TE','TE_in_STSv','ant_STSf','FST','TPO','TAa','STGr','Tpt','parabelt','CL/ML','AL/RTL','CM','RM/RTM','RTp','R/RT','AI','Pi','Ins','Ri','MT','V4d','V4v','V3d/V3A','V3v','V2','V1']
# figure的参数额外设置
fig = plt.figure(figsize=(20,10))
# axes的参数额外设置
ax1 = fig.add_subplot(121)
ax2 = fig.add_subplot(122)
# 调用函数
## 第1张ax
plot_matrix_figure(data1, ax=ax1)
## 第2张ax
plot_matrix_figure(data2, ax=ax2, row_labels_name=labels, col_labels_name=labels, cmap='Reds', colorbar=True, colorbar_label_name='BBB', title_name='AAA', vmin=0, vmax=0.1)
# 保存图片
fig.savefig("./figures/matrix.png", dpi=250, bbox_inches='tight')函数名字:plot_matrix_figure
参数(大部分参数都有默认值,如无需要,不需更改):
-
data: 输入的数据;2维numpy数组 -
ax: 子图 -
row_labels_name: 每一列的名字;列表 -
col_labels_name: 每一行的名字,列表 -
row_labels_fontsize: 每一列的名字的大小;数值 -
col_labels_fontsize: 每一行的名字的大小;数值 -
cmap: 颜色主题;字符串(默认“bwr”,更多主题见:https://matplotlib.org/stable/gallery/color/colormap_reference.html#sphx-glr-gallery-color-colormap-reference-py) -
colorbar: 是否显示colorbar;True/False -
colorbar_label_name: colorbar名字;字符串 -
colorbar_label_fontsize: colorbar的label的字体大小 -
colorbar_label_pad: colorbar与主图之间的间隔;数值 -
colorbar_tick_fontsize: colorbar的tick的字体大小;数值 -
colorbar_tick_rotation: colorbar的tick的字体旋转角度;数值 -
x_rotation: 每一列的名字的旋转角度;数值 -
title_name: 子图标题名字;字符串 -
title_fontsize: 子图标题字体大小;数值 -
title_pad: 子图标题与子图间距;间距 -
vmax: colorbar显示最大值;数值 -
vmin: colorbar显示最小值;数值 -
aspect: 矩阵的每个cell是否维持方形;数值,默认'equal'(如果是数值,则指定每个cell的宽是长的多少倍)
import numpy as np
import matplotlib.pyplot as plt
from Plot_figure.plot_figure import *

data = {'lh_V1':10, 'lh_MST':15, 'rh_V1':-10}

# 全脑1
fig = plot_human_brain_figure(data, cmap='Reds', vmin=-15.1234, vmax=15.1234, colorbar_label_name='AAA', colorbar_decimals=3)
fig.savefig(r"./figures/human_brain1.png", dpi=250, bbox_inches='tight')

# 全脑2
fig = plot_human_brain_figure(data, surf='inflated', cmap='bwr', vmin=-15.1234, vmax=15.1234, colorbar_label_name='AAA', colorbar_location='bottom')
fig.savefig(r"./figures/human_brain2.png", dpi=250, bbox_inches='tight')

# 仅左脑
fig = plot_human_hemi_brain_figure(data, hemi='lh', cmap='bwr', vmin=-15.1234, vmax=15.1234, colorbar_nticks=5)
fig.savefig(r"./figures/human_brain3.png", dpi=250, bbox_inches='tight')

# 仅右脑
fig = plot_human_hemi_brain_figure(data, hemi='rh', surf='midthickness', cmap='bwr', vmin=-15, vmax=15, colorbar_shrink=0.9)
fig.savefig(r"./figures/human_brain4.png", dpi=250, bbox_inches='tight')函数名字:plot_human_brain_figure,
参数(大部分参数都有默认值,如无需要,不需更改):
-
data: 输入的数据,一般情况下是字典,也可以指定.csv文件 -
surf: underlay的surface图形选择;'veryinflated'(默认)/'inflated'/'midthickness'/'sphere' -
cmap: 颜色主题;字符串(默认“bwr”,更多主题见:https://matplotlib.org/stable/gallery/color/colormap_reference.html#sphx-glr-gallery-color-colormap-reference-py) -
vmin: colorbar显示最小值;数值 -
vmax: colorbar显示最大值;数值 -
colorbar: 是否显示colorbar;True/False -
colorbar_location: colorbar的显示位置;'right'/'bottom' -
colorbar_label_name: colorbar名字;字符串 -
colorbar_label_rotation: colorbar名字的旋转角度;数值 -
colorbar_decimals: colorbar中tick保留的小数位数;整数 -
colorbar_fontsize: colorbar的名字的字体大小 -
colorbar_nticks: colorbar上需要标几个tick;自然数 -
colorbar_shrink: colorbar的大小 -
colorbar_aspect: colorbar的长宽比;数值 -
colorbar_draw_border: colorbar是否标出黑色轮廓;True/False
函数名字:plot_human_hemi_brain_figure
参数,大部分与[5.2.1 全脑](# 5.2.1 全脑)相同,仅增加一项(大部分参数都有默认值,如无需要,不需更改):
-
hemi: 半脑;'lh'/'rh'
import numpy as np
import matplotlib.pyplot as plt
from Plot_figure.plot_figure import *

# 全脑1
data = {'lh_V1':15, 'rh_V1':15}
fig = plot_macaque_brain_figure(data, surf='inflated', colorbar_direction='vertical', colorbar_label_name='AAA')
fig.savefig(r"./figures/macaque_brain1.png", dpi=250, bbox_inches='tight')

# 全脑2
data = r"E:\jupyter_notebook\jupyter_notebook_code\git_repositories\Plot_figure\macaque_charm5.csv"
fig = plot_macaque_brain_figure(data, surf='inflated', cmap='bwr', colorbar_direction='horizontal', colorbar_label_name='AAA')
fig.savefig(r"./figures/macaque_brain2.png", dpi=250, bbox_inches='tight')

# 仅左脑
data = {'lh_V1':15}  # 如果只画左脑,请把右脑数据删除
fig = plot_macaque_hemi_brain_figure(data, hemi='lh', cmap='bwr', ax_direction='vertical')
fig.savefig(r"./figures/macaque_brain3.png", dpi=250, bbox_inches='tight')

# 仅右脑
data = {'rh_V1':-10, 'rh_MST':10}  # 如果只画右脑,请把左脑数据删除
fig = plot_macaque_hemi_brain_figure(data, hemi='rh', surf='white', colorbar_direction='horizontal', colorbar_label_name='AAA', cmap='bwr')
fig.savefig(r"./figures/macaque_brain4.png", dpi=250, bbox_inches='tight')函数名字:plot_macaque_brain_figure
参数(大部分参数都有默认值,如无需要,不需更改):
-
data: 输入的数据,一般情况下是字典,也可以指定.csv文件 -
surf: underlay的surface图形选择;'inflated'(默认)/'midthickness'/'white'/'pial' -
vmin: colorbar显示最小值;数值 -
vmax: colorbar显示最大值;数值 -
colorbar: 是否显示colorbar;True/False -
colorbar_direction: colorbar的显示方向;'vertical'/'horizontal' -
colorbar_label_name: colorbar名字;字符串 -
colorbar_label_fontsize: colorbar名字的字体大小;数值 -
colorbar_tick_fontsize: colorbar的tick的字体大小;数值 -
colorbar_tick_rotation: colorbar的tick的字体旋转角度;数值 -
colorbar_outline: colorbar是否标出黑色轮廓;True/False
如果只画左脑,请把右脑数据删除;如果只画右脑,请把左脑数据删除
函数名字:plot_macaque_hemi_brain_figure
参数,大部分与[6.2.1 全脑](# 6.2.1 全脑)相同,仅增加一项(大部分参数都有默认值,如无需要,不需更改):
-
hemi: 半脑;'lh'/'rh' -
ax_direction: ax的排布方式;'horizontal'/'vertical'


