Skip to content

A simple command line interface software to dynamically generate graph of stocks

Notifications You must be signed in to change notification settings

Rishikesh-12/stock-visualizer

Folders and files

NameName
Last commit message
Last commit date

Latest commit


History

6 Commits


Repository files navigation

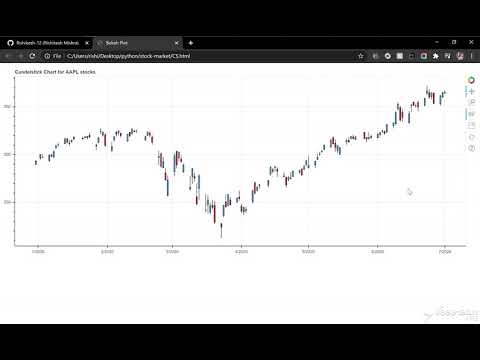
stock-visualizer

A simple command line interface software to dynamically generate graph of stocks

How to use this: -

  1. Fork this repository
  2. Go to forked repository and clone it
  3. run the python script. "python main.py"

Check out demonstartion on youtube.


IMAGE ALT TEXT HERE

About

A simple command line interface software to dynamically generate graph of stocks

Resources

Stars

Watchers

Forks

Releases

No releases published

Packages

No packages published