| title |
|---|
Curve features |
What types of timeseries does each model produce?
- Deaths
- Number of hospital beds
- ICU cases
- Infections
- R value
Here is a list of all feature descriptors of the timeseries curves. These can then be filtered or searched to find "interesting" or similar curves. This is a combination of the idea of slicenostics and the feature extraction ideas presented in Tam, Gary K. L., H. Fang, A. J. Aubrey, P. W. Grant, P. L. Rosin, D. Marshall, and M. Chen. “Visualization of Time-Series Data in Parameter Space for Understanding Facial Dynamics,” 2011. doi:10.1111/v30i3pp0901-0910. (pdf). Where appropriate these metrics are combined and noted with which section of the paper these come from. All sections that start with ??? don't have "slicenostic-friendly" names yet.
The idea of slicenostics is to give meaningful names to aspects of curves (features). These are particular features of particular curves that one may want to see. The idea of human-readable names is to help give some intuition as to what are important features. These measures should all be between 0 and 1 or -1 and 1.
There are a bunch of ways to calculate this:
- number of critical points (where derivitive is 0)
- frequency (from Fourier decomposition)
- variance
| high | low |
|---|---|
 {width=250px} {width=250px} |
 {width=250px} {width=250px} |
How well the curve can be approximated by a straight line (S4.5)
| high | low |
|---|---|
| {width=250px} |
 {width=250px} {width=250px} |
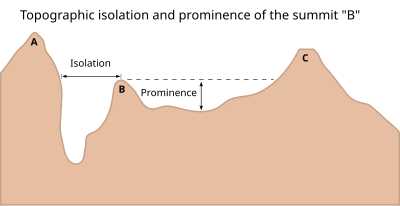
This is the topographic definition where it's the height of the curve
Related to the average slope
| high | low |
|---|---|
 {width=250px} {width=250px} |
 {width=250px} {width=250px} |
- (from Chris weaver, evacuation scenario)
- ratio of arc length to straight line distance
| high | low |
|---|---|
 {width=250px} {width=250px} |
 {width=250px} {width=250px} |
A measure of how well the curve can be approximated by a parabola (S4.5)
| high | low |
|---|---|
 {width=250px} {width=250px} |
 {width=250px} {width=250px} |
| high | low |
|---|---|
 {width=250px} {width=250px} |
 {width=250px} {width=250px} |
| high | low |
|---|---|
| {width=250px} |
{width=250px} |
This is the ratio of the height of the curve at the start to the end
| high | low |
|---|---|
 {width=250px} {width=250px} |
 {width=250px} {width=250px} |
This is the ratio of the height of the curve at the start to the end
| high | low |
|---|---|
| {width=250px} |
{width=250px} |
This can be based on the skewness calculation (S4.2)
| high | low |
|---|---|
 {width=250px} {width=250px} |
{width=250px} |
Generalizes median (or centrality) to manifolds: https://www.tandfonline.com/doi/abs/10.1198/jcgs.2011.09224
| high | low |
|---|---|
 {width=250px} {width=250px} |
 {width=250px} {width=250px} |
There are several of these. See Global Sensitivity Analysis. The Primer by Andrea Saltelli Marco Ratto Terry Andres Francesca Campolongo Jessica Cariboni Debora Gatelli Michaela Saisana Stefano Tarantola (https://onlinelibrary.wiley.com/doi/book/10.1002/9780470725184) for a list.
- Average gradient
- Variance-based
- Regression coefficients
- Fourier amplitude sensitivity test
- High-dimensional model representations
- Contribution to the sample mean plot (https://www.sciencedirect.com/science/article/pii/S0951832008002743?via%3Dihub)
Either arc length or length of time
Looking at the first 4
linear/quadratic/cubic fits
Predicting a value based on linear combination of the previous