- Authors: Samson Bakos, Morris Chan, Waiel Tinwala, Revathy Ponnambalam
A Data Analysis/ Machine Learning project developed for DSCI 522 in the UBC Master of Data Science Program
Disclaimer: The current project is only for educational purposes. It shall not be used for actual diagnoses.
Our primary research question is: can we diagnose or stratify risk for cervical cancer based on lifestyle factors, sexual history, and comorbidities using a machine learning model? This question is naturally subdivided into risk level and diagnosis questions depending on the relative strengths of the models that prove effective for this data. Classifiers with hard predictions (i.e. k-NN) are effective for diagnosis, while classifiers with probabilistic predictions (i.e. logistic regression) are effective for predicting level of risk depending on computed prediction probabilities.
This research question is important because of the importance of early diagnoses in cancer patients, where the timing of diagnosis can mean the difference between treatable and terminal illness, often with a small margin of error. Successful implementation of this project will not only add an additional, non invasive diagnostic tool (based solely upon medical records and subjective self-reported patient data rather than in-person examination), it will also help identify at-risk individuals who can be more closely monitored for cervical cancer before it develops and progresses.
This data is sourced from 'Transfer Learning with Partial Observability Applied to Cervical Cancer Screening.'(2017) by Kelwin Fernandes, Jaime S. Cardoso, and Jessica Fernandes. It was accessed through the UCI Machine Learning Repository, found here: https://archive.ics.uci.edu/ml/datasets/Cervical+cancer+%28Risk+Factors%29. The data is composed of survey results and medical records for 858 female patients from 'Hospital Universitario de Caracas' in Caracas, Venezuela, alongside the results of four traditional diagnosis tests (i.e. biopsy).
Data was first split into training and test sets. Initial EDA on training data included investigating the distribution of missing values (due to missing/ 'prefer not to say' survey responses), as well as visualizing distributions of each potential feature for both the positive and negative diagnosis class using bar charts and histograms to identify intially promising classification characteristics. Simple tables were also prepared to investigate class imbalance in the dataset.
The modelling process involved training and testing the dataset on a variety of models to investigate what algorithms might be suitable for this problem. Models tested include Decision Trees, kNN, SVC, Naive Bayes, Logistic Regression, and Random Forests. Models were assessed primarily on the criteria of maximum recall to minimize Type II Error, with a working threshold of 0.28 precision (twice the population positive rate), set quite low due to the dangers of false negatives in the diagnosis/ risk identification context. Models were run in their default form before undergoing hyperparameter tuning, and finally evaluation on the test set.
Final results are presented in the form of PR Curves, and test scores for precision, recall, f1 and AUC. Unfortunately, no model seems sufficient to provide a deployment worthy level of performance as a diagnostic tool, but there is some possible application as a flagging system for further testing, but this would in no way replace normal diagnostic checks.
Further exploration may be meritted to investigate other models that may more accurately capture the data/target relationship, feature engineering and transformation, and testing of model decision thresholds based on the PR curves.
To run this analysis using Docker:
- Clone the repo, and navigate to the root of the project repo using your terminal
- Use the following commands
Run the analysis (Approximately 10 min):
docker run --rm -v /$(pwd):/home samsonbakos/cervical-cancer-predictor make -C /home all
Clean up the analysis:
docker run --rm -v /$(pwd):/home samsonbakos/cervical-cancer-predictor make -C /home clean
-
Clone the repo, and navigate to the root of the project repo using your terminal.
-
Create the environment:
conda env create -f environment.yamlhttps://github.com/UBC-MDS/cervical-cancer-group7/blob/main/environment.yaml
-
Activate the environment
conda activate rfcc -
Use the following MAKE commands:
To generate the entire project:
Make allTo clean all outputs:
Make cleanTo run an individual script (see manual scripts section below)
Make <script>
NOTE: if the render on the analysis document fails, ensure that tidyverse and rmarkdown are installed on your computer. See step 7 of "Manually Run Scripts" below.
Makefile Dependencies:

To manually run the data analysis on your local device, follow these steps. These scripts can be run in their current quoted form and will automatically generate the files on your device without manipulating the arguments.
- Clone this repository to your local device or download the source code.
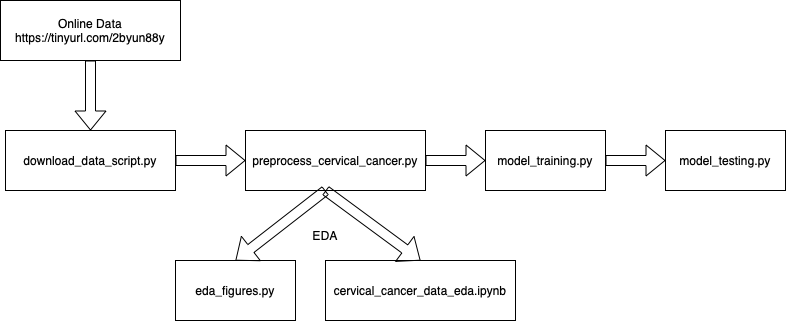
- Run the following script to download the data:
python src/01-download_data_script.py --url="https://archive.ics.uci.edu/ml/machine-learning-databases/00383/risk_factors_cervical_cancer.csv" --output_file="data/raw/risk_factors_cervical_cancer.csv"
(input: the data url, output: raw dataset)
- Run the following script to clean and split the data:
python src/02-preprocess_cervical_cancer.py --input_file="data/raw/risk_factors_cervical_cancer.csv" --out_dir="data/processed"
(input: the raw data, output: cleaned and split data)
- (Optional) Execute the notebook
cervical_cancer_data_eda.ipynbto view the EDA or run:
python src/03-eda_figures.py --train_data='data/processed/train.csv' --out_file='results'
(input: training set, output: literate EDA notebook, and/or EDA figures)
- Run the following script to train the models:
python src/04-model_training.py --data_path='data/processed/train.csv' --output_path_cv='results'
(input: training set, output: model objects saved as .joblib files)
- Run the following script to test the models and generate results:
python src/05-model_testing.py --data_path='data/processed/test.csv' --output_path='results'
(input: test set and traind models, output: final figures and tables).
- (Optional) To re-render the final report, run the following scripts:
Rscript -e "install.packages('tidyverse'), repos='https://cran.rstudio.com/')" (ensure Tidyverse is installed)
Rscript -e "install.packages('rmarkdown'), repos='https://cran.rstudio.com/')" (ensure Rmarkdown is installed)
Rscript -e "rmarkdown::render('Analysis_Docs/Analysis.Rmd')"
(input: results figures and tables, output: .html analysis)
Raw final results can be found in the results subdirectory, and the final written report in the Analysis_Docs subdirectory. The final report can be rendered using the script above, the .html can be loaded in browser, or the .Rmd file can be rendered on RStudio as long as the files produced by the other scripts above have not been moved/ renamed.
PIPELINE FLOWCHART:
https://raw.githubusercontent.com/UBC-MDS/cervical-cancer-group7/main/src/AnalysisPipeline.png
The materials here are licensed under Creative Commons Attribution-NonCommercial-NoDerivatives 4.0 International (CC BY-NC-ND 4.0) license.
Attribution-NonCommercial-NoDerivatives 4.0 International (CC BY-NC-ND 4.0)
- Fernandes, K., Cardoso, J.S., Fernandes, J. (2017). Transfer Learning with Partial Observability Applied to Cervical Cancer Screening. In: Alexandre, L., Salvador Sánchez, J., Rodrigues, J. (eds) Pattern Recognition and Image Analysis. IbPRIA 2017. Lecture Notes in Computer Science(), vol 10255. Springer, Cham. https://doi.org/10.1007/978-3-319-58838-4_27
- Bosch, F. X., et al. "Risk factors for cervical cancer in Colombia and Spain." International journal of cancer 52.5 (1992): 750-758.
- Castellsagué, Xavier. "Natural history and epidemiology of HPV infection and cervical cancer." Gynecologic oncology 110.3 (2008): S4-S7.
- Petignat, Patrick, and Michel Roy. "Diagnosis and management of cervical cancer." Bmj 335.7623 (2007): 765-768.
- McKinney, W. & others, 2010. Data structures for statistical computing in python. In Proceedings of the 9th Python in Science Conference. pp. 51--56.
- Pedregosa, F., Varoquaux, Ga"el, Gramfort, A., Michel, V., Thirion, B., Grisel, O., ... others. (2011). Scikit-learn: Machine learning in Python. Journal of Machine Learning Research, 12(Oct), 2825--2830.
- Wickham H, Averick M, Bryan J, Chang W, McGowan LD, François R, Grolemund G, Hayes A, Henry L, Hester J, Kuhn M, Pedersen TL, Miller E, Bache SM, Müller K, Ooms J, Robinson D, Seidel DP, Spinu V, Takahashi K, Vaughan D, Wilke C, Woo K, Yutani H (2019). "Welcome to the tidyverse." Journal of Open Source Software, 4(43), 1686. doi:10.21105/joss.01686.
- VanderPlas, J., Granger, B., Heer, J., Moritz, D., Wongsuphasawat, K., Satyanarayan, A., ... Sievert, S. (2018). Altair: Interactive statistical visualizations for python. Journal of Open Source Software, 3(32), 1057.
- https://github.com/joblib/joblib