STSM Norrkoping
##Introduction:
From 11-16 October 2016 Adriaan Dokter (University of Amsterdam) and Hidde Leijnse (Royal Netherlands Meteorological Institute, KNMI) visited the Swedish Meteorological and Hydrological Institute (SMHI) in Norrköping, Sweden, for two short-term scientific missions (STSMs). The aim of the STSMs was to integrate the bird algorithm developed by Dokter et al. that produces VPBs (vertical profile of birds) into the BALTRAD toolbox. This integration is carried out in collaboration with BALTRAD developers of SMHI, in particular Dr. Günther Haase and Dr. Anders Henja. Integration of the algorithm into the BALTRAD toolbox allows straightforward generation of VPBs for all European radars delivering volume data to BALTRAD. A second aim was, after integration of the algorithm, to compile a case study dataset for as many radars and countries as possible.
 Fig. 1. Swedish meteorological and hydrological institute (SMHI), Norrköping, Sweden
Most effort was spent into realizing the first aim, which was a prerequisite for completing the aim of compiling a case study dataset. When applying for these STSMs the expectation was that the algorithm would have been tested and implemented on the BALTRAD server already by mid 2015. Refactoring of the code by the Netherlands eScience Centre however took more time than expected. A large part of this STSM was therefore spent on testing the new refactored code, and on adapting the code so that it can be implemented into the BALTRAD toolbox, which is currently the main bottleneck towards the goal of operationally producing bird profiles for all European radars.
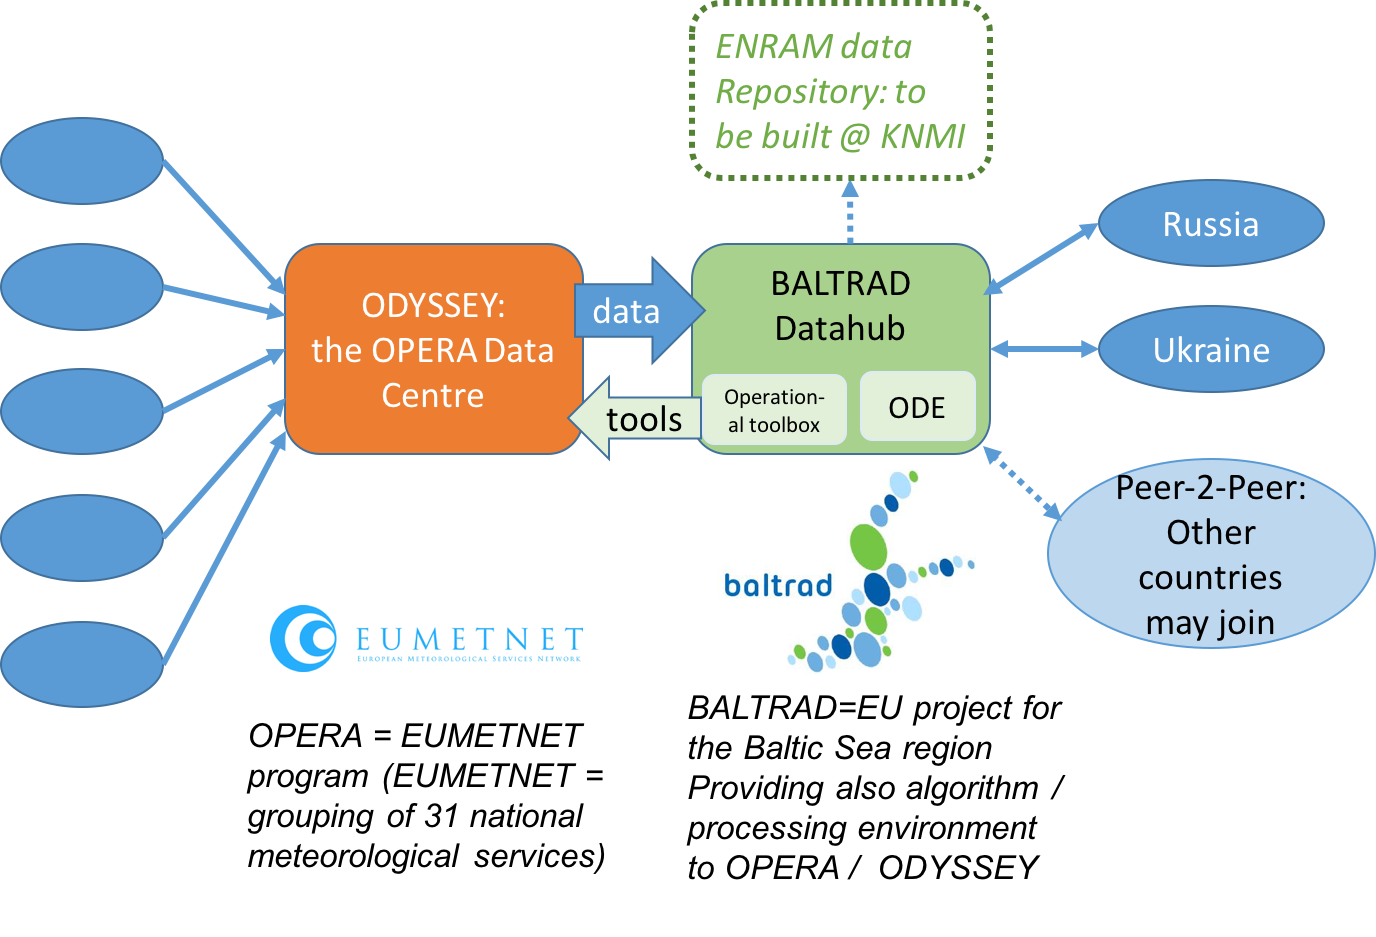 Fig. 2. OPERA, ODYSSEY and BALTRAD
Figure 2 shows the current radar infrastructure we propose to use and develop within ENRAM. The bird algorithm is to be implemented in the BALTRAD toolbox. The BALTRAD server is to receive a copy of all volume data sent to the OPERA data centre. BALTRAD has a very flexible infrastructure for implementing operational algorithms acting on radar volume data, which makes implementation of the bird algorithm there feasible. BALTRAD is to produce the VPBs for all European radars. These VPB products are to be forwarded to KNMI and collected within the KNMI data centre.
We first identified a to-do list for this week:
- Define output format of the bird algorithm and nomenclature of quantities
- Implement output format in ODIM-h5
- Compile base and refactored versions of the algorithm on the ODE (Opera Development Environment) of BALTRAD
- Compare output of both versions, to validate the output of the refactored version.
- Select a suitable time period for the case study dataset, including a major migration event across Europe
- Generate composite images of European radars to make a horizon scan of which radars provide data suitable for quantifying bird migration.
- Make an inventory of Z and V data availability and Nyquist intervals for each radar
- Determine strategy for handling data requests and support by ENRAM members
- Following a discussion with Anders Henja (lead programmer of BALTRAD), we identified an important modification of the algorithm that was required to integrate it into the production system of BALTRAD. Due to the refactoring by the Netherlands eScience centre the code was no longer thread-safe, which is not acceptable because BALTRAD runs in a parallel computing environment. The
vol2birdcode therefore needed to be adjusted, such that global objects are no longer used to contain the data.
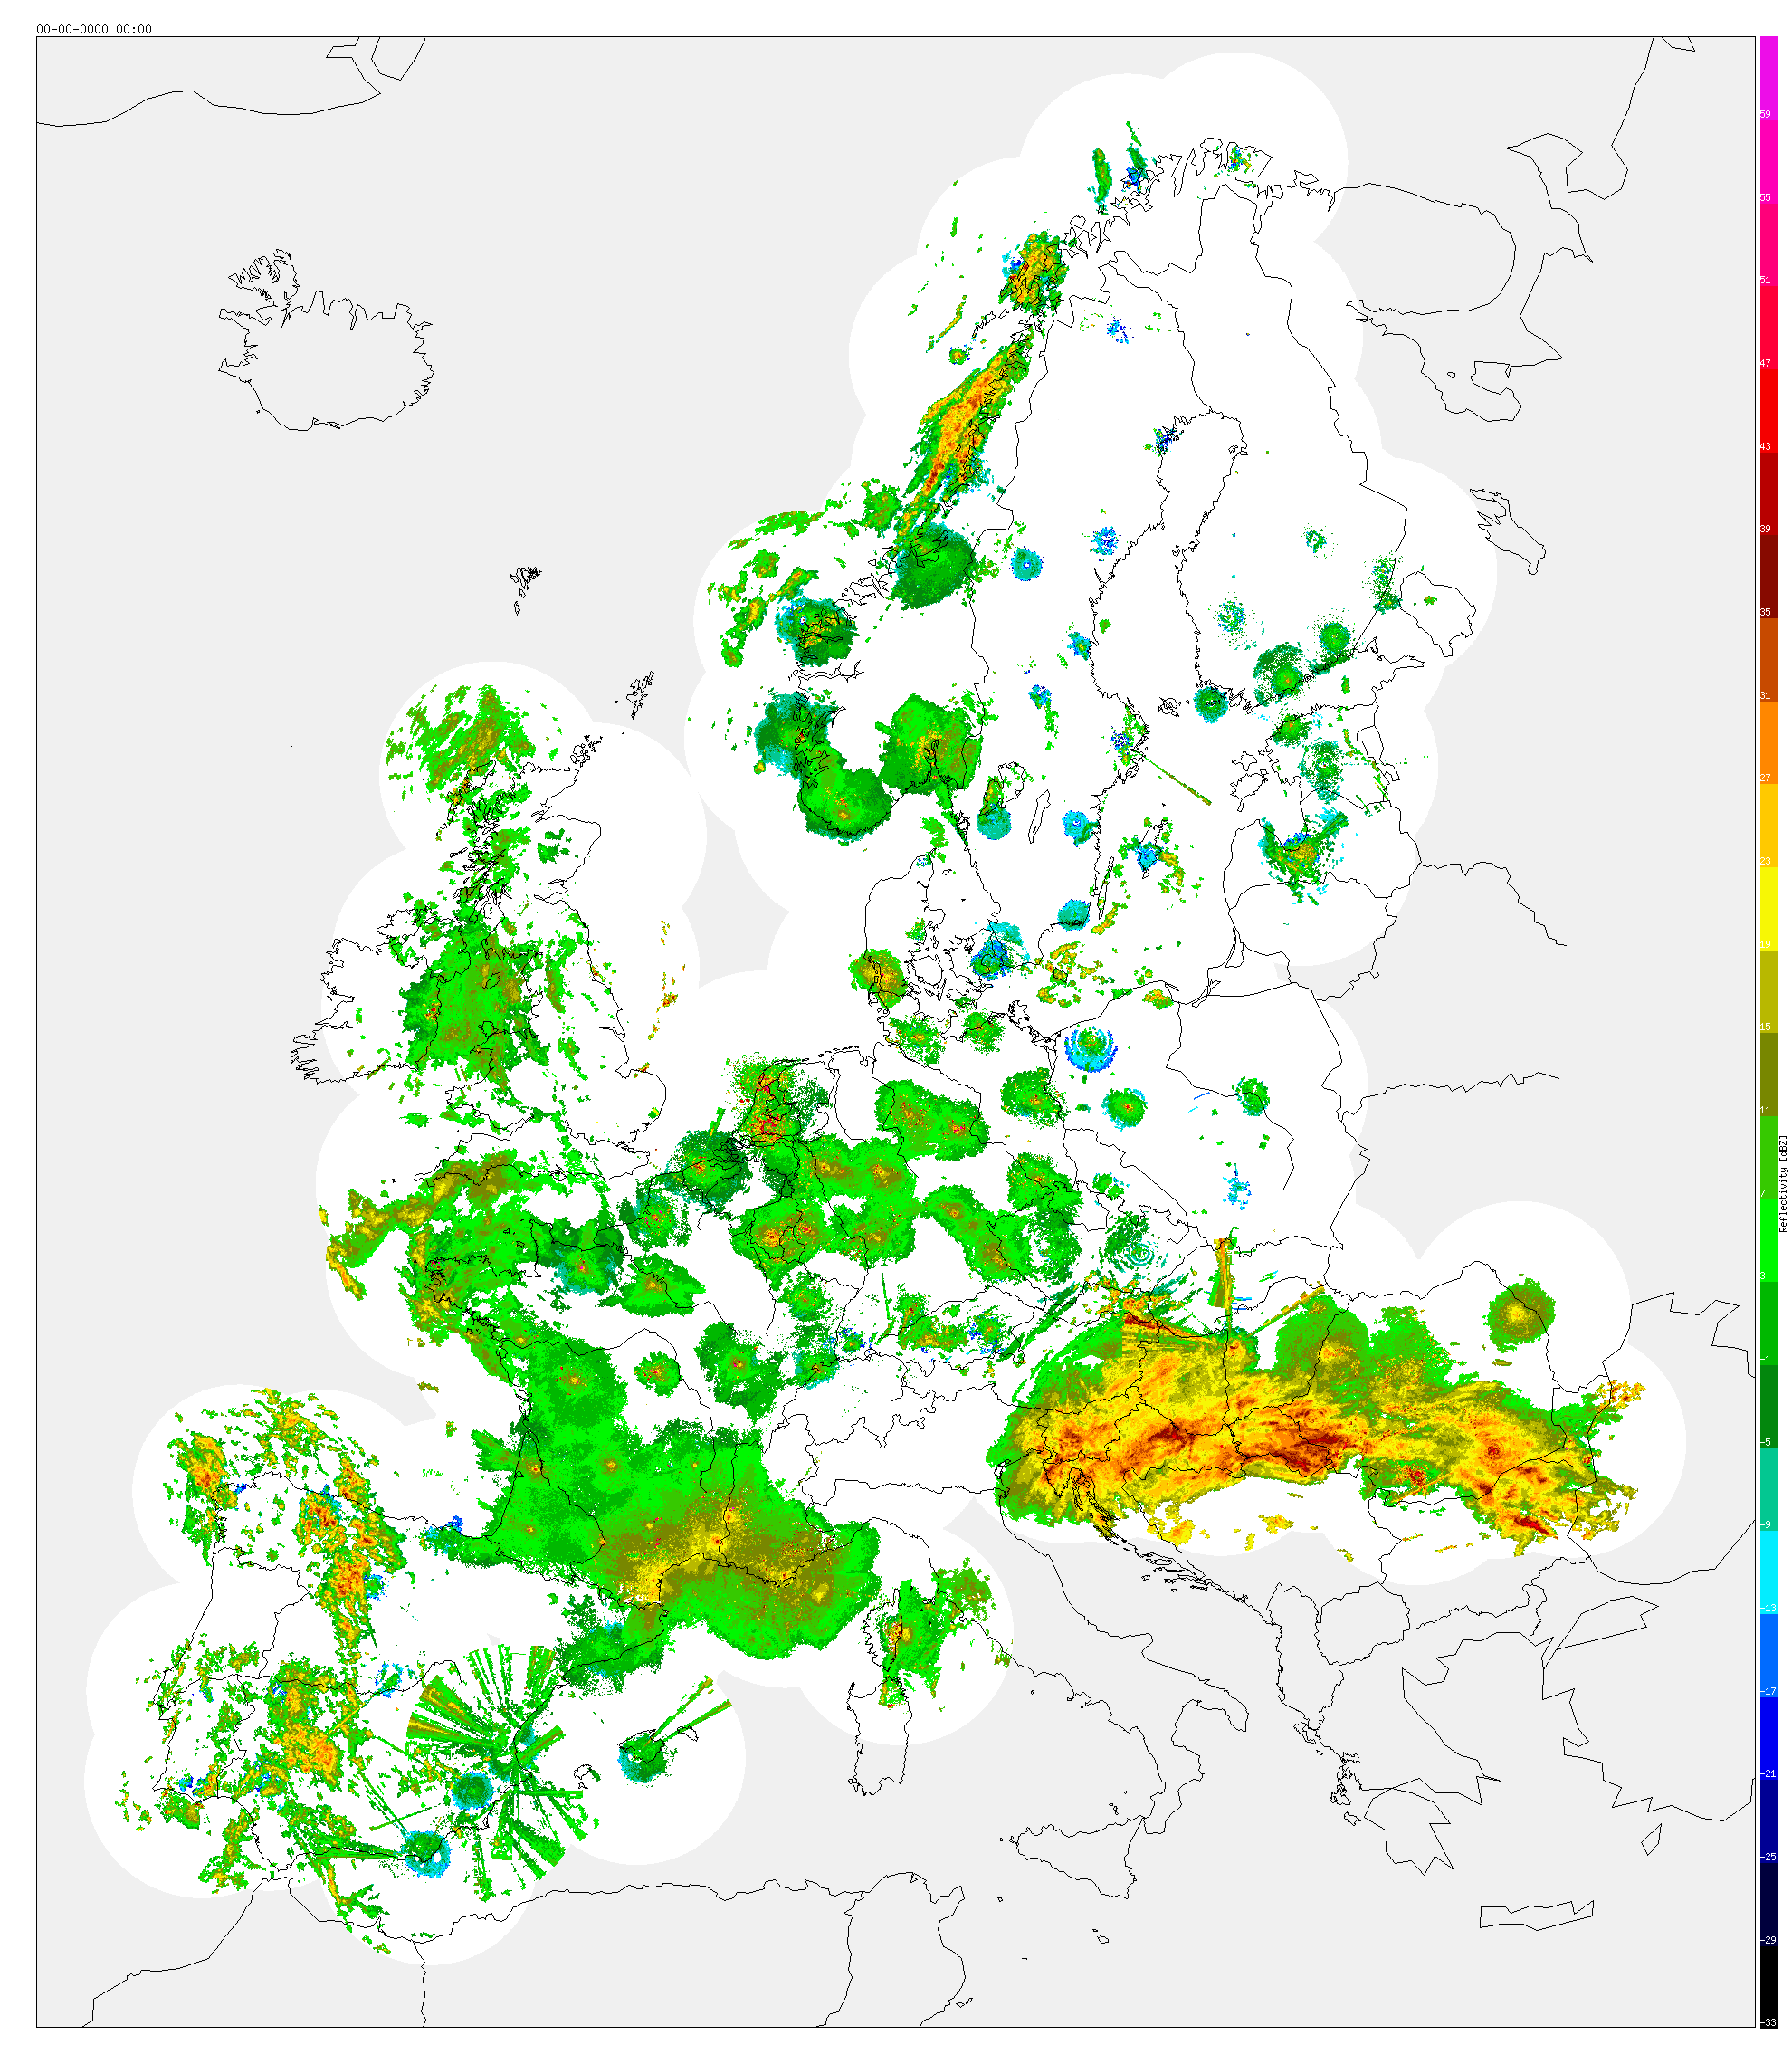 Fig. 3. Reflectivity composite for 2015-10-10 20:00 UTC
Figure 3 shows the OPERA maximum-reflectivity composite for a night with a lot of bird migration across Europe. Several noteworthy features of the reflecitivity composite during this migration event were identified:
- Spain, Hungary, Latvia: many sources of radio noise are visible in the imagery (showing as spikes), which will require methods to correct and remove these sources of noise.
- Sweden and Finland show much weaker signals compared to Norway. Especially to close distance between the southern Norwegian and Swedish radars suggest these differences cannot be solely attributed to differences in migration intensity. Likely these countries apply different pre-processing to their data.
- S-band radars southern France show a much longer detection range than C-band radars, suggesting the signal to noise ratio of S-band radars is higher than of C-band radars.
##Goals reached:
- discussed with Anders Henja the requirements for integrating the algorithm into the toolbox, so that it can be implemented on the BALTRAD server
- in the code, added automated selection of scans based on minimum Nyquist velocity
- in the code, added automated selection of scans based on availability of both DBZ and VRAD
- compiled the BALTRAD toolbox on different operating systems (Mac OSX and Ubuntu Linux)
- adapted the algorithm so that it works with the BALTRAD toolbox, and removed platform-specific functions
- made the code thread safe by removing all global variables, and putting these in structs; the code needs to be thread safe in order for it to be implemented in BALTRAD
- made the code generally applicable to both conventional radars and dual-pol radars
- compiled and tested the code on the OPERA Development Environment (ODE); testing the code here can lead to quick implementation at the BALTRAD server
- debugged the code for memory leaks introduced by the modifications and refactoring
- installed the code on the OPERA Development Environment (ODE) in Karlstad.
- selected a time period for testing the algorithm in a case study: 9-11 October
- produced OPERA radar composite images for this period
- secured data from the 10 countries that have made both DBZ and VRAD available (BE, DK, EE, FI, FR, HR, NL, SE, SI, UK)
- secured data from Angelholm radar for the intercomparison campaign period
- made an inventory of the data availability and Nyquits velocities
- made an open access github repository with the code and its documentation
- on github, defined a list of issues and desired future changes to the code for implementation on the BALTRAD server
- discussed how the output of the algorithm could be made available for users
- defined the data structure of the HDF5 representation of the bird profiles
##Milestones
#####Milestone 1: a more generic version of the bird algorithm It is now much easier to produce bird density profiles from OPERA data. The algorithm is more generic so that it can deal with a wider range of radars.
#####Milestone 2: defined a standard output format, compatible with ODIM-h5 HDF5 is a file format that makes possible the management of extremely large and complex data collections. Using HDF5 as a file format, OPERA has defined the HDF5 representation of the OPERA Data Information Model ODIM_h5 for the storage of radar data. Using the conventions of ODIM-h5 we have defined a data model for the storage of vertical profiles of birds (VPBs). The data model can be found in appendix 1.
#####Milestone 3: compilation of the algorithm on the OPERA Development environment (ODE). The ODE is located on the same server as the operational BALTRAD system, which is therefore a great step towards operationalisation of the algorithm.
- several small compatibility issues need to be solved: handling data stored not in unsigned char, reading wavelength from file, etc. For a complete list see the issues on github.
- write routines that write algorithm output to an ODIM-h5 file, using the data model we defined in this STSM
- write a python wrapper around the algorithm, for integration in the production pipeline. A prototype of this python wrapper has been provided by Anders Henja, which still needs to be adjusted to the bird algorithm.
- Apply algorithm to all data for 9-11 October
- Visualize output of the case study
- Analyze output of the case study
- Process data from Angelhom radar for the validation campaign
- conversion EEC data format of SMHI to ODIM-h5
- calculate VPBs (vertical profiles of birds)
- Operationally implement the algorithm on BALTRAD server
##Individual contributions
#####Adriaan Dokter
My STSM focussed on compiling, testing and adjusting the qualitative functioning of the code in the new Baltrad environment. I identified a suitable migration period throughout Europe that could be used as a test case. A large portion of my time was spent on repairing the new vol2bird version, which no longer produced correct output after refactoring by the Netherlands eScience centre. Using intercomparisons of the output of the refactored version with the base version of the algorithm, bugs and the algorithm workflow was corrected. I set up an open github repository for the algorithm software with associated wiki web page for communicating radar data availability and data requirements to the ENRAM community. Here the installation procedures for the algorithm in the new BALTRAD environment were documented. I adjusted the algorithm to be compatibile with dual-pol radar data. Finally on the last day I managed to compile the code on the Opera Development Environment (ODE), which is the same server as the operational production system for BALTRAD.
#####Hidde Leijnse Most of my STSM focussed on streamlining the code to make it compatible with meteorological data:
- defining the ENRAM-ODIM-h5 format
- making the code thread safe
- selection of scans based on Nyquist velocity
- made a start with implementing the output ENRAM-ODIM-h5 format in the code
I also worked on selecting a time period for the case study:
- making composite imagery
- securing data for case study period, including Belgium (for which no VRAD data were available at BALTRAD)