This is a project that uses Java to plot the famous Lorenz Attractor. Ever since I read Ian Stewart's "Does God Play Dice?", the Lorenz Attractor has fascinated me. I was inspired by Code Train's "Coding Challenge #12: The Lorenz Attractor in Processing".
The Lorenz Attractor is a popular mathematical figure developed by Edward Lorenz when attempting to solve a series of ODEs modelling atmospheric convection:
where the standard values for the constants are:
which lead to the following image:
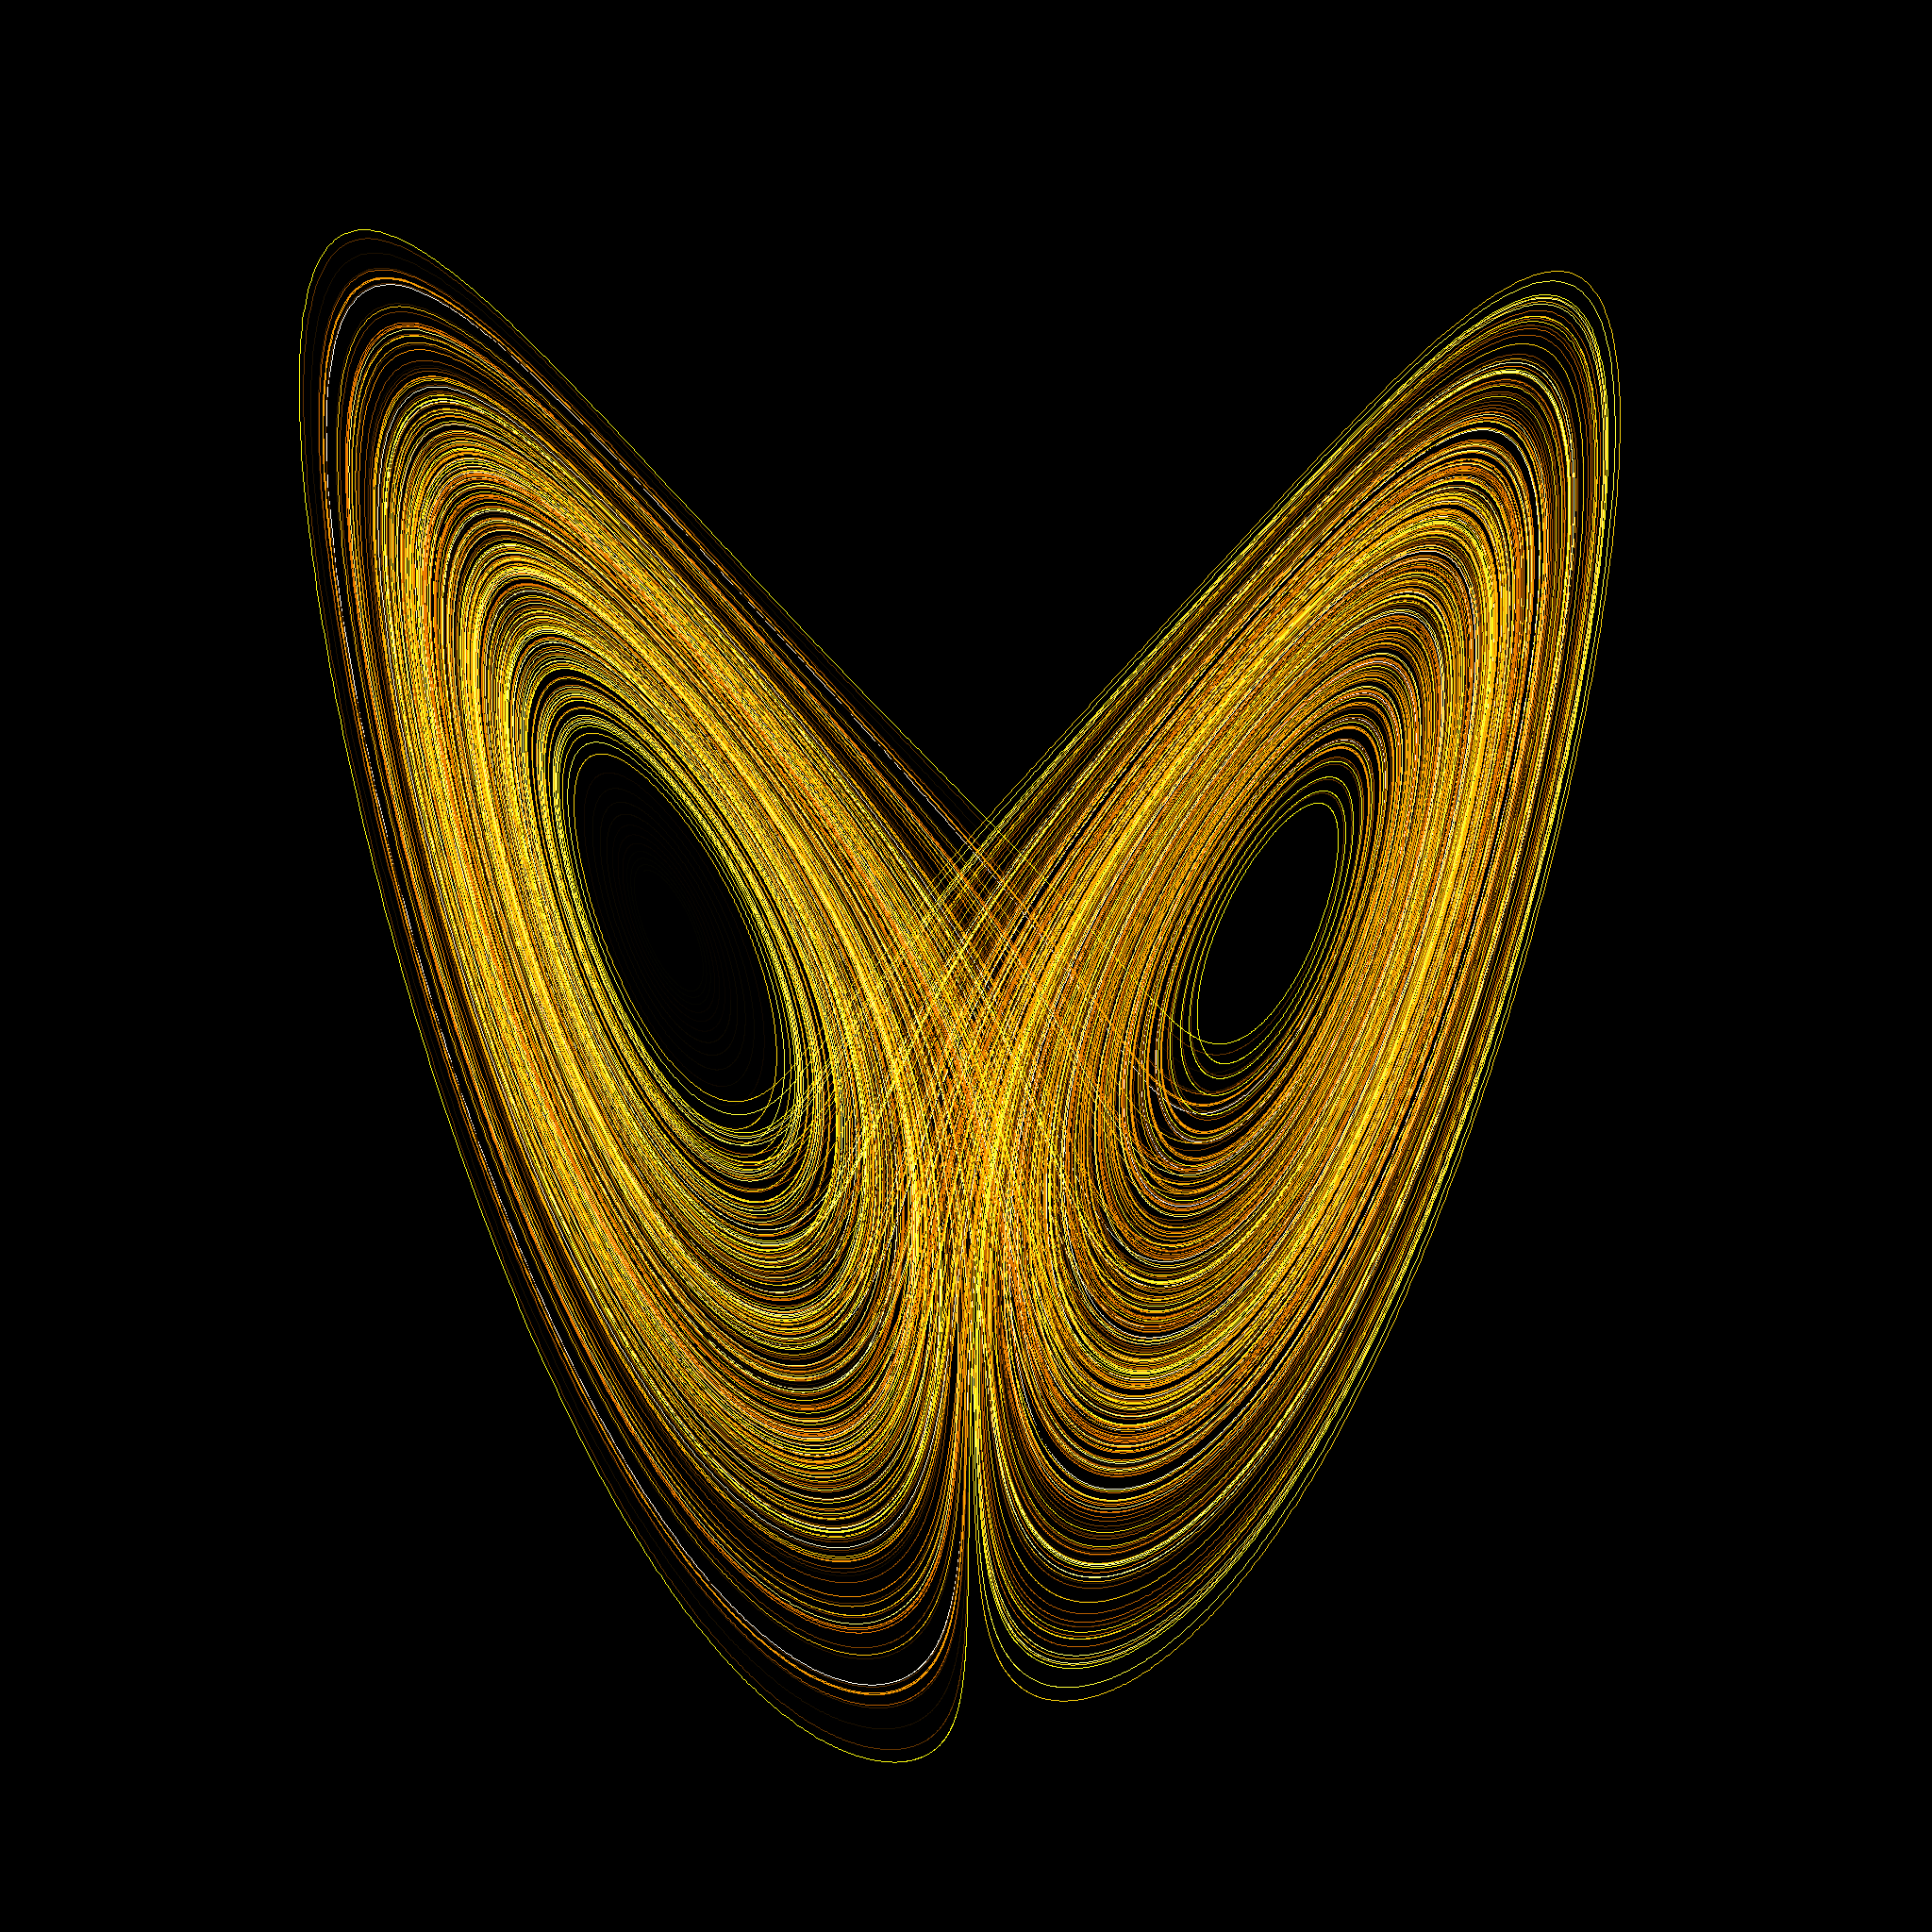
It is a prime example used when showcasing how chaos arises in deterministic equations. The program uses the stdlib to create a canvas, upon which we plot the (x,z) coordinates of the numerical solution. The solution is found via Euler's Method, using (x,y,z) = (0,20,12) as initial conditions, and a step size h = 0.01. We use a for loop with 100001 iterations to iteratively calculate the new coordinates that will be plotted.
There are 2 key distinguishing features in this program:
- the colour of the attractor
- the capacity to save the coordinates
The attractor is drawn using a "rainbow" effect (if specified within the constructor). This is done by converting the colour from RGB to HSB (hue, saturation and brightness). The hue is then changed slightly, producing a new colour. We then turn this colour back into its RGB form. This is done by the function changeHue:
public Color changeHue(Color colour, int factor) {
        // change colour to hsb
        float[] hsb = Color.RGBtoHSB(colour.getRed(), colour.getGreen(), colour.getBlue(),null);

        // change the hue value
        hsb[0] = (float) ((hsb[0] + factor * 0.01) % 255);

        // create a new rgb constant with the new hue value
        int rgb = Color.HSBtoRGB(hsb[0], hsb[1], hsb[2]);

        // get the rgb attributes of the new colour
        // to understand how:
        // https://android.jlelse.eu/java-when-to-use-n-8-0xff-and-when-to-use-byte-n-8-2efd82ae7dd7
        int red = (rgb>>16)&0xFF;
        int green = (rgb>>8)&0xFF;
        int blue = rgb&0xFF;
        return new Color(red,green,blue);
    }
These are the results:


To change the speed at which the colour changes simply change the 0.01 in hsb[0] = (float) ((hsb[0] + factor * 0.01) % 255); to a smaller number.
If the colour inserted is green, I created a special method that made the curve alternate between green and yellow:
public Color changeGreen(Color colour, int factor) {
        int red = (int) ((colour.getRed() + factor*0.8) % 255);
        int green = colour.getGreen() > factor ? (int) ((colour.getGreen() - factor * 0.8) % 255) : colour.getGreen();
        int blue = colour.getBlue() % 64;

        return new Color(red,green,blue);
    }
This produces some rather beautiful results:

Again, to change the speed at which the colour changes you can change the constant 0.8when defining green and red.
Lastly, you can also choose to simply draw the curve in mono-colour.

With each iteration, the calculated coordinates are stored in a JSONArray, which is in turn stored in a JSONObject and ultimately saved in a json file. We ensure that old files are not overridden, and provide methods to generate new file names. Coordinates created during the program's current execution are all saved to the same file. The option to save coordinates can be enabled within the class constructor. I thought that saving the coordinates could be useful, as it could allow programs in other languages to plot the attractor without necessarily having to undertake all the calculations.
Functionality has also been included so that, given a correctly formatted json file, the Lorenz Curve can be plotted from coordinates found within the file. After using a parser to get the file, I used a for loop to iterate through the key-value pairs in the JSONObject of the file. I then put all of the key-value pairs into a Tree-Map (so that they were sorted), and gave the pairs appropiate data types (int and double[]). This then allowed me to easily plot all the coordinates with the appropiate colour.