Skip to content

aniketroy997/Logistic-Regression-Shiny-App

Folders and files

NameName
Last commit message
Last commit date

Latest commit


History

3 Commits


Repository files navigation

logistic-regression-Shiny-App


what is Logistic Regression ? 🤔

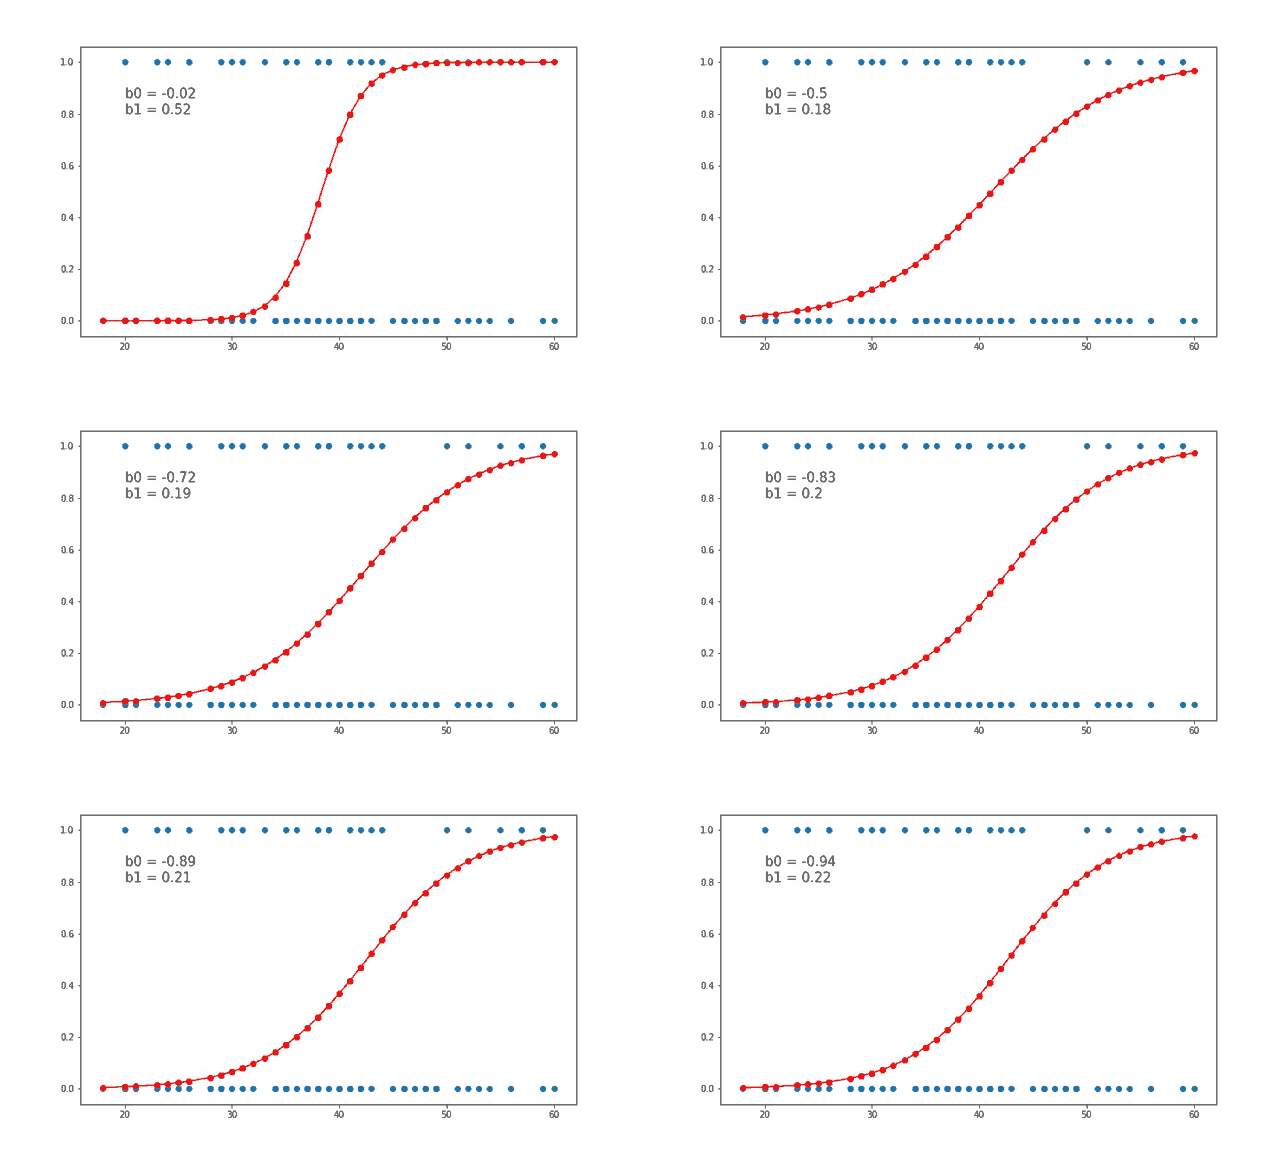
Logistic regression is a statistical model that in its basic form uses a logistic function to model a binary dependent variable, although many more complex extensions exist. In regression analysis, logistic regression (or logit regression) is estimating the parameters of a logistic model (a form of binary regression).

alt text

For example, if we are modeling people’s sex as male or female from their height, then the first class could be male and the logistic regression model could be written as the probability of male given a person’s height, or more formally:

P(sex=male|height)

Written another way, we are modeling the probability that an input (X) belongs to the default class (Y=1), we can write this formally as:

P(X) = P(Y=1|X)

We’re predicting probabilities? I thought logistic regression was a classification algorithm?

Note that the probability prediction must be transformed into a binary values (0 or 1) in order to actually make a probability prediction. More on this later when we talk about making predictions.

Logistic regression is a linear method, but the predictions are transformed using the logistic function. The impact of this is that we can no longer understand the predictions as a linear combination of the inputs as we can with linear regression, for example, continuing on from above, the model can be stated as:

p(X) = e^(b0 + b1X) / (1 + e^(b0 + b1X))

I don’t want to dive into the math too much, but we can turn around the above equation as follows (remember we can remove the e from one side by adding a natural logarithm (ln) to the other):

ln(p(X) / 1 – p(X)) = b0 + b1 * X

This is useful because we can see that the calculation of the output on the right is linear again (just like linear regression), and the input on the left is a log of the probability of the default class.

This ratio on the left is called the odds of the default class (it’s historical that we use odds, for example, odds are used in horse racing rather than probabilities). Odds are calculated as a ratio of the probability of the event divided by the probability of not the event, e.g. 0.8/(1-0.8) which has the odds of 4. So we could instead write:

ln(odds) = b0 + b1 * X

Because the odds are log transformed, we call this left hand side the log-odds or the probit. It is possible to use other types of functions for the transform (which is out of scope_, but as such it is common to refer to the transform that relates the linear regression equation to the probabilities as the link function, e.g. the probit link function.

We can move the exponent back to the right and write it as:

odds = e^(b0 + b1 * X)

All of this helps us understand that indeed the model is still a linear combination of the inputs, but that this linear combination relates to the log-odds of the default class.


About

No description, website, or topics provided.

Resources

Stars

Watchers

Forks

Releases

No releases published

Packages

No packages published

Languages