A python module for reading *.eso files generated by EnergyPlus
The building simulation engine EnergyPlus stores its main output in a file with the ending '.eso'. This format makes it easy to log variable values during simulation, but is hard to use for post-processing. EnergyPlus offers a sqlite version of this data, but using it requires understanding the eso file format itself. EnergyPlus also can output a csv file, but that is limited in the number of columns.
The esoreader module makes it very easy to explore the output of EnergyPlus, say, in an
IPython notebook interactive environment.
- parse *.eso files to pandas
DataFrames - search for output variables by substring
The easiest way to install esoreader ist to do:
$ pip install esoreader
In [1]: import esoreader

In [2]: eso = esoreader.read_from_path(r"C:\...\experiment01.eso")

In [3]: eso.find_variable('heating')
Out[3]:
[('TimeStep', None, 'Heating:EnergyTransfer'),
 ('TimeStep',
  'DEFAULT_ZONEZONEHVAC:IDEALLOADSAIRSYSTEM',
  'Zone Ideal Loads Zone Total Heating Energy')]

In [4]: df = eso.to_frame('heating energy')

In [5]: df[:10]
Out[5]:
   DEFAULT_ZONEZONEHVAC:IDEALLOADSAIRSYSTEM
0                            8596050.719384
1                            8672511.667988
2                            8737544.119096
3                            8799182.506582
4                            8862116.803218
5                            8928593.537248
6                            5296266.226576
7                                  0.000000
8                                  0.000002
9                                  0.000000

In [6]: df.plot()
Out[6]: <matplotlib.axes._subplots.AxesSubplot at 0x7854090>

In [7]: %matplotlib tk

In [8]: df.plot()
Out[8]: <matplotlib.axes._subplots.AxesSubplot at 0x7b66670>
Notice in the above example how the variable is matched by substring - you
don't have to specify the whole variable name. Each matching variable will show
up in the resulting DataFrame with the key used as the column name - in this
case 'DEFAULT_ZONEZONEHVAC:IDEALLOADSAIRSYSTEM'.
Also, as this is an IPython session, I used the magic variable incantation %matplotlib tk to switch on the GUI loop that allowes plotting. You can choose another backend if you like, but I am pretty sure that tk should be available with your Python distribution.
An example with multiple columns:
In [1]: eso.find_variable('net thermal radiation heat gain energy')
Out[1]:
[('TimeStep',
  'DPVROOF:1157058.3',
  'Surface Outside Face Net Thermal Radiation Heat Gain Energy'),
 ('TimeStep',
  'DPVWALL:1157028',
  'Surface Outside Face Net Thermal Radiation Heat Gain Energy'),
 ('TimeStep',
  'DPVWALL:1157027',
  'Surface Outside Face Net Thermal Radiation Heat Gain Energy'),
 ('TimeStep',
  'DPVROOF:1157058.2',
  'Surface Outside Face Net Thermal Radiation Heat Gain Energy'),
 ('TimeStep',
  'DPVFLOOR:1157042',
  'Surface Outside Face Net Thermal Radiation Heat Gain Energy'),
 ('TimeStep',
  'DPVWALL:1157029',
  'Surface Outside Face Net Thermal Radiation Heat Gain Energy'),
 ('TimeStep',
  'DPVROOF:1157058.1',
  'Surface Outside Face Net Thermal Radiation Heat Gain Energy'),
 ('TimeStep',
  'DPVROOF:1157058.0',
  'Surface Outside Face Net Thermal Radiation Heat Gain Energy'),
 ('TimeStep',
  'DPVWALL:1157026',
  'Surface Outside Face Net Thermal Radiation Heat Gain Energy')]

In [2]: df = eso.to_frame('net thermal radiation heat gain energy')

In [3]: df.plot()
Out[3]: <matplotlib.axes._subplots.AxesSubplot at 0xbd11150>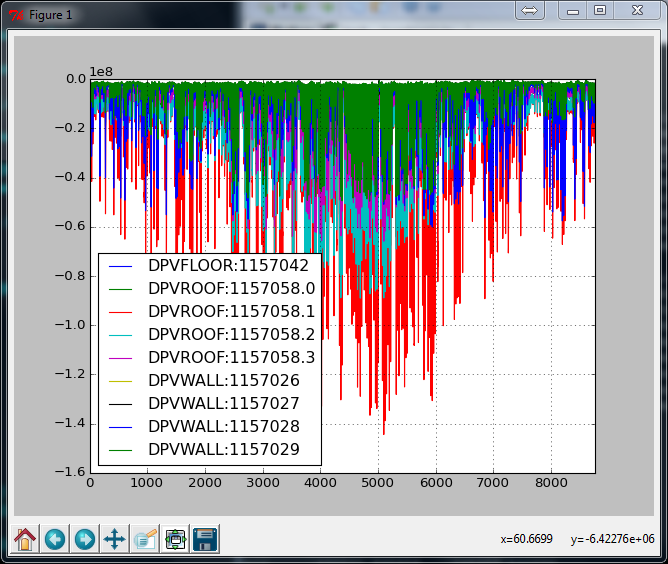
You can use the key parameter to select a single column:
In [1]: df = eso.to_frame('net thermal radiation', key='DPVROOF:1157058.3')

In [2]: df[:10]
Out[2]:
   DPVROOF:1157058.3
0    -8985934.016604
1    -8453530.628023
2    -7611418.498363
3    -6936246.291753
4    -6206109.857522
5    -5879653.262523
6    -5676601.453020
7    -5606988.050900
8    -5844912.195173
9 -4712551.701917You can use the index parameter to specify an index for the DataFrame. Since this is time-series data, a common pattern could be:
In [1]: hours_in_year = pd.date_range('2013-01-01', '2013-12-31 T23:00', freq='H')

In [2]: df = eso.to_frame('heating energy', index=hours_in_year)

In [3]: df[:10]
Out[4]:
                     DEFAULT_ZONEZONEHVAC:IDEALLOADSAIRSYSTEM
2013-01-01 00:00:00                            8596050.719384
2013-01-01 01:00:00                            8672511.667988
2013-01-01 02:00:00                            8737544.119096
2013-01-01 03:00:00                            8799182.506582
2013-01-01 04:00:00                            8862116.803218
2013-01-01 05:00:00                            8928593.537248
2013-01-01 06:00:00                            5296266.226576
2013-01-01 07:00:00                                  0.000000
2013-01-01 08:00:00                                  0.000002
2013-01-01 09:00:00 0.000000NOTE: This is an older API that requires a better understanding about the eso file structure than using the pandas interface explained above. It is cumbersome but might be of use to users not using pandas. If you come up with a nicer interface, send me a pull request.
The eso files generated by EnergyPlus contains a data dictionary, which
describes the values reported by EnergyPlus. The list of values reported
depends on the simulation input file, specifically the Output:Variable and
Output:Meter objects. EnergyPlus can output the same variable at different
frequencies and for different "keys", which are for instance surfaces or
equipment names.
Following the data dictionary is a list of output variable values for each of the configured variable coordinates.
The output of the esoreader module is therefore a data dictionary object that contains a mapping of variable "coordinates" (grouping of reporting frequency, key and variable name) to the index used by EnergyPlus and a data object, which essentially just maps that index to the timeseries data.
import esoreader

PATH_TO_ESO = r'/Path/To/EnergyPlus/Output/eplusout.eso'
dd, data = esoreader.read(PATH_TO_ESO)
frequency, key, variable = dd.find_variable('Zone Ventilation Total Heat Loss Energy')[0]
idx = dd.index[frequency, key, variable]
time_series = data[idx]- Issue Tracker: https://github.com/architecture-building-systems/esoreader/issues
- Source Code: https://github.com/architecture-building-systems/esoreader
If you are having issues, please let us know. We have a mailing list located at: http://groups.google.com/group/esoreader.
This project is licensed under the terms of the MIT license. See the file "LICENSE" in the project root for more information.
This module was developed by Daren Thomas at the chair for Architecture and Building Systems (A/S) at the Institute of Technology in Architecture, ETH Zürich, Switzerland.