-
Notifications
You must be signed in to change notification settings - Fork 19
Web interface
This is a default page of Live Profiler UI. You can see last aggregated snapshots grouped by app and label. All column in the table are sortable. You can find a snapshot by part of the label.
Each snapshot has next actions:
- /profiler/tree-view.phtml - a link to method tree page with stats and graphs of each method
- /profiler/result-diff.phtml - a link to snapshots comparison interface, allows to compare two snapshots with different dates
- /profiler/list-view.phtml - a link to method list page with full list of called methods
- /profiler/result-flamegraph.phtml - a link to flame graph page of last snapshot data
- a button to rebuild today's snapshot - it's helpful if you need to see request's fresh data
Also on this page you can rebuild a custom snapshot with today's fresh data. To do it just select an app and label and tap the button "Aggregate today snapshot"

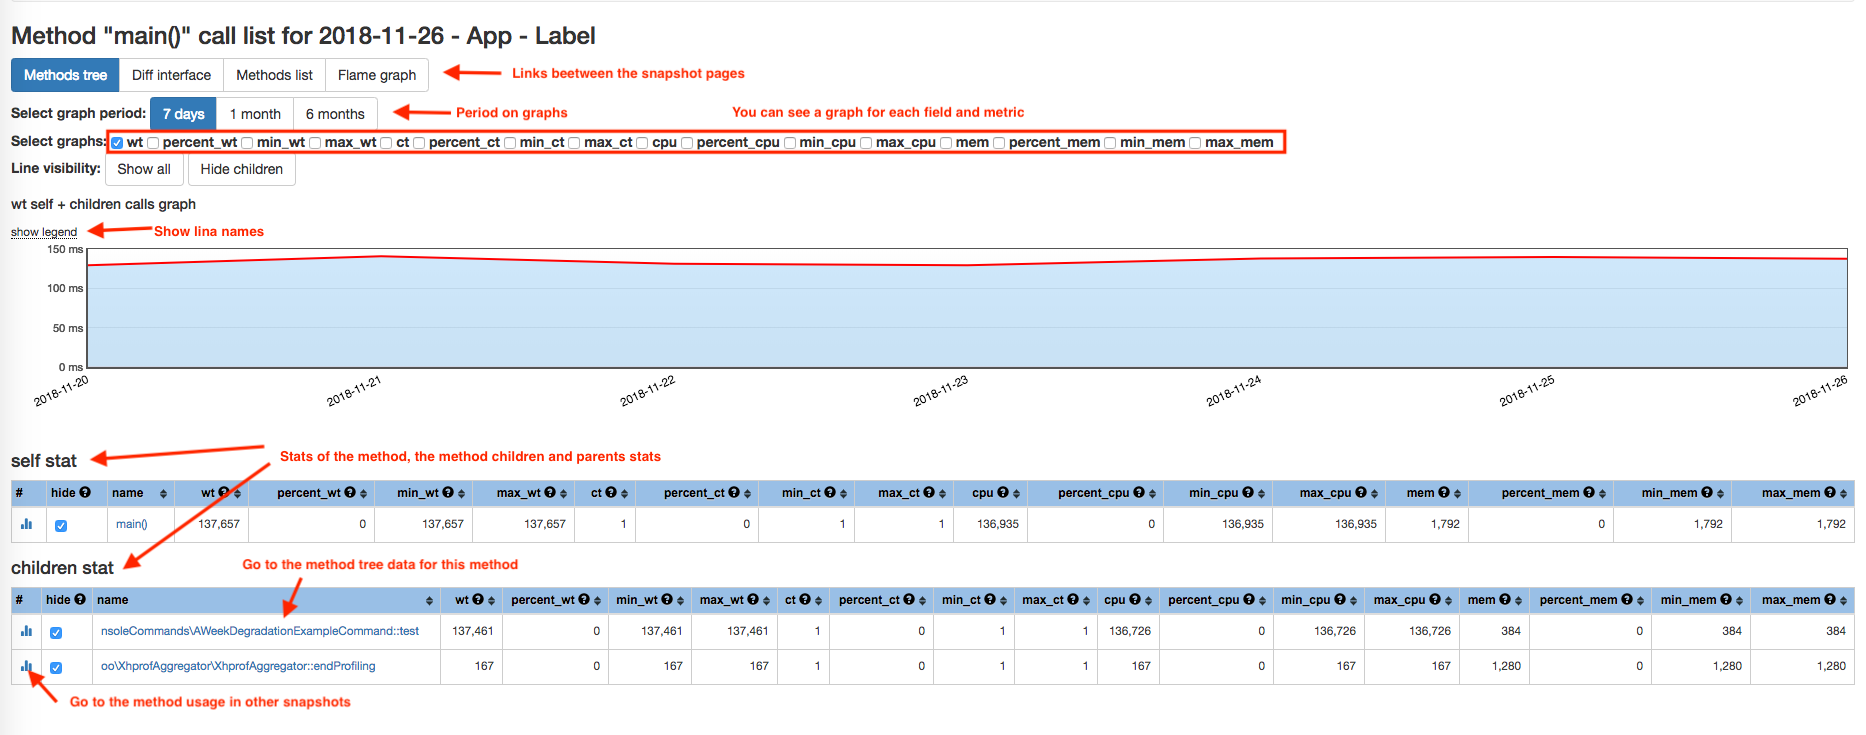
On this page you can see graphs for every collected parameters and every methods up to 6 months. Each graphs also included children stats. It helps to see the history of changes, stats for this method, the method's parents amd the method's children.
There are 3 main blocks on this page:
- page settings. You can choose a graph period, select which graphs you would like to see and show/hide children's lines on graphs
- graphs for each params selected above in "Select graphs" section
- tables with current method's, its children's and parents' stats. Each table are sortable and sorted by first param by default. If you tab on the method name you will go to this method's stat page. An icon in the first column follows to method usage page for this method

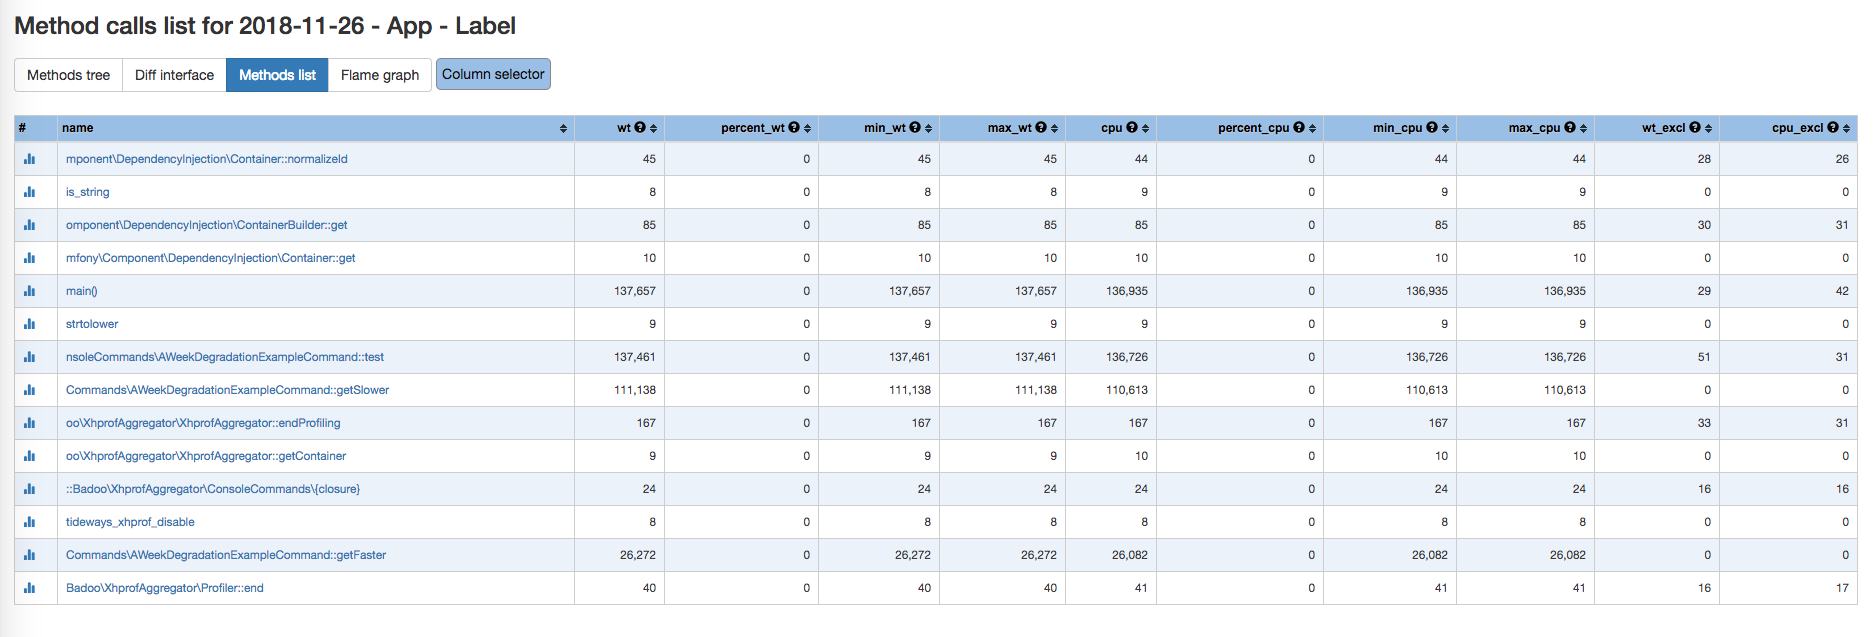
On this page you can see full method list for current request. It allows to sort them and find the most slow method.

It's a page to compare particular request for two dates and see what became worse. You can choose a dates interval and a parameter. Table sorted by changing of the parameter value for each method on each date. The most changed methods are placed on the top. First column contains a changed method with a link to method tree page. Next columns - param difference, calls count on first and second dates. Last column are the most useful and contains the list of children sorted by the param changes.
Also the page has a button "Go to flame graph" to flame graph page in diff mode.

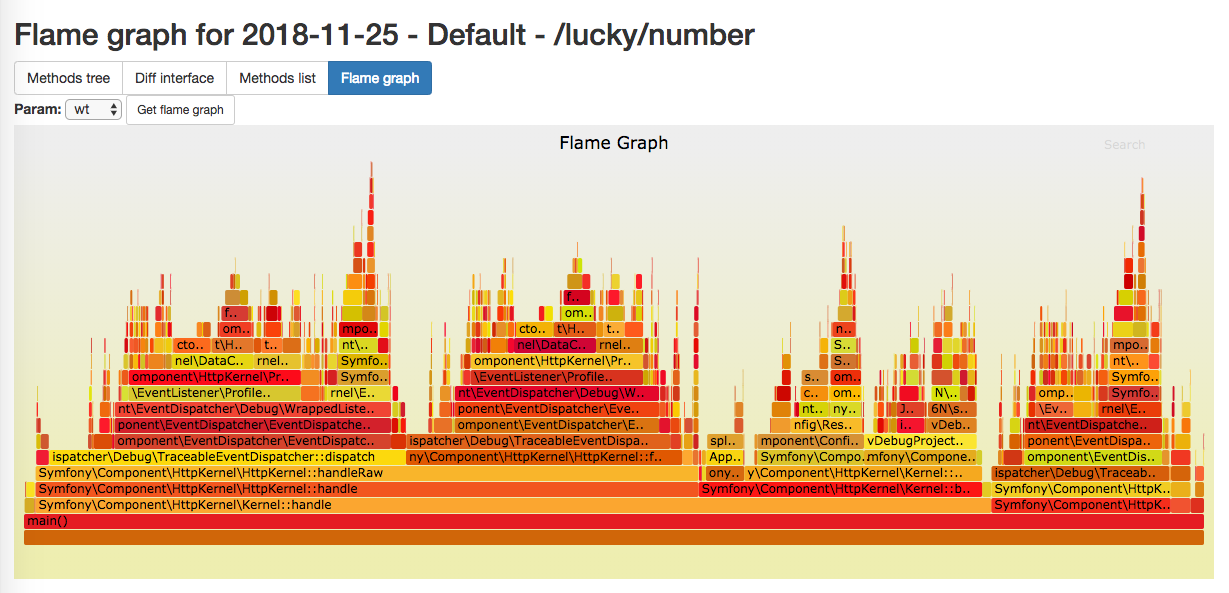
On this page you can see flame graph of the last aggregated request. You can choose one of parameter you would like to check: time or memory usage.
You also can get a flame graph by differences of param between two dates. To use this mode just select "use diff" checkbox. It's a good way to find out which method became slower or use more memory.

On this page you can see when the method was called last time. It may be helpful for refactoring purposes and find unused methods. You can enter a part of the method name and select the needed method from the dropdown list. Also you can choose a number of days when you would like to check the method usage.
The result table contains a list of snapshots when the method was used last time. You can sort this table by any column.

On this page you can see the most changed methods in any requests for two dates, for example, today and a week ago. It can help to find a place of a potential performance problem.
Select the period, parameter and mode. The default there is 3 months period and "Snapshots" mode. There are 3 available modes:
- Snapshots - returns the list of the most changed snapshots - the easiest way to find a performance issue
- Methods exclude children - the list of the most changed methods exclude children methods usage
- Methods include children - the list of the most changed methods with children methods usage
