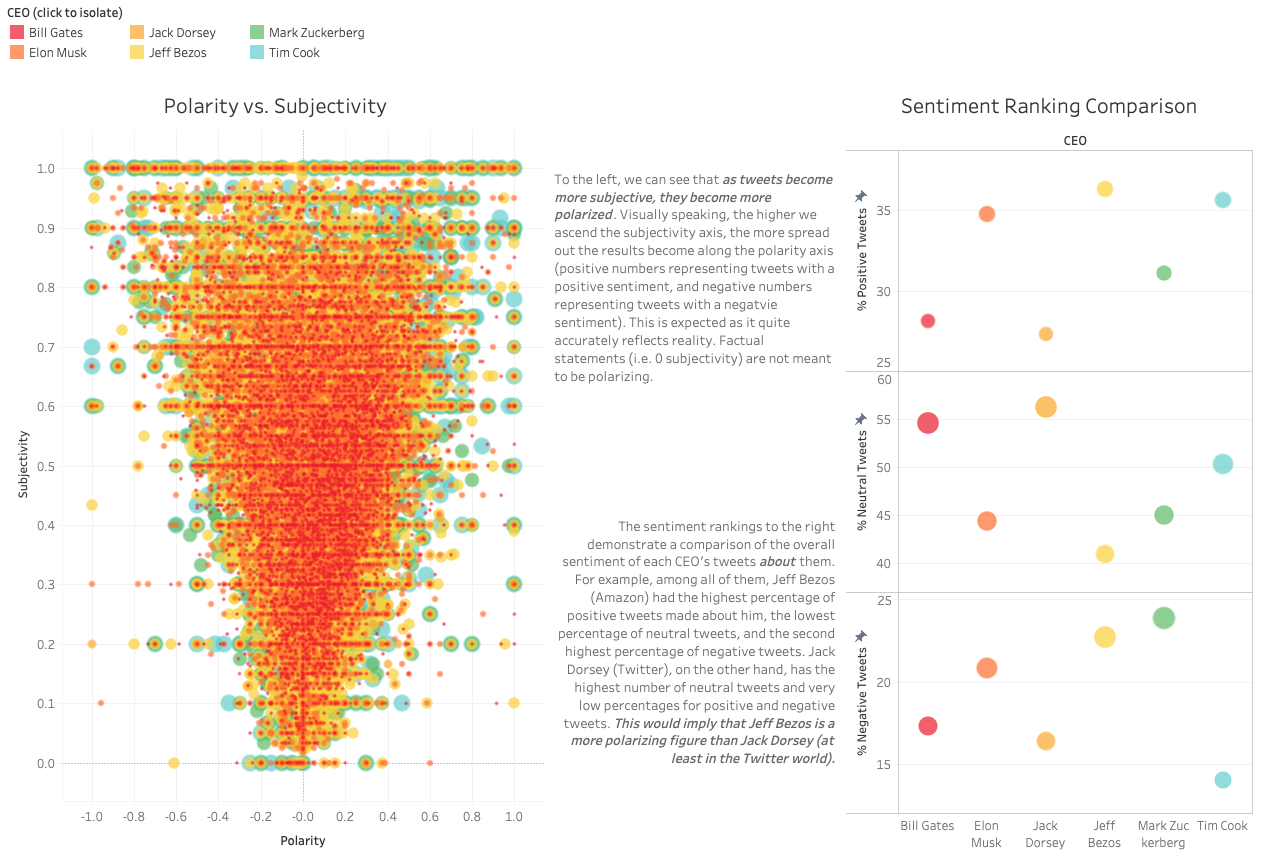
For an interactive view of my Tableau visualization, please visit https://tabsoft.co/2D2G38Z
Some CEOs carry enough popularity to garner significant Twitter traffic about them. I chose to consider 6 of the most well-known: Elon Musk (Tesla, SpaceX, Neuralink, Starlink, The Boring Company), Bill Gates (former CEO of Microsoft), Mark Zuckerberg (Facebook), Jeff Bezos (Amazon), Tim Cook (Apple), and Jack Dorsey (Twitter). The goal was to perform a sentiment analysis of tweets about these CEOs using Python and Tableau.
I first needed to get API keys for myself by setting up an app on Twitter's developer website. Then, using the Python library Tweepy inside of a Jupyter Notebook, I scraped the Twitter API to pull tweets about each CEO. I was able to do a maximum of around 50,000 tweets for the more popular Elon Musk and Bill Gates, while the others pulled in between 5,000 and 35,000 tweets. The scrape exports each tweet as a fairly extensive JSON object, but since I was only interested in textual sentiment analysis, I narrowed down the scrape to only pull the text. This also saved massive amounts of storage space when each collection of tweets was exported to a txt file.
Once I collected all of the tweets for each CEO in a txt file, I converted the data into a Pandas dataframe and used the re.sub() method to clean out unnecessary elements such as mentions, hyperlinks, and unicode.
In order to determine the sentiment of each tweet, I used the TextBlob library which is an NLTK-based NLP library that allowed me to bypass training a language model with machine learning and skip straight to testing/categorization. Each tweet was given a subjectivity score ranging from 0 to 1 (0 = factual, 1 = opinionated), and a polarity score (-1 to 0 being negative, 0 being neutral, and 0 to 1 being positive). Once each tweet was analyzed and scores recorded to the dataframe, I exported the result to a CSV. I also ran a few visualizations such as wordclouds and histograms to get a sneak peak at the analysis.
I attempted using the Blobber Naive-Bayes Analyzer as well. The results were not any better, and it did not categorize neutral tweets. It also took significantly longer than the built-in TextBlob analyzer.
After I had a working CSV file for each CEO, I imported them to Tableau by union and filtered by CEO when constructing my worksheets. The analysis I completed is available via the link at the top of this README or in picture format below:
