Generalized Additive Models (GAMs) are extensions of linear models (LMs) that allow complex, non-linear patterns to be modeled and "smoothed". Like LMs, confidence intervals can be calculated from GAMs. A useful but lesser-known property of GAMs is that you can calculate derivatives for the smoothed lines. This makes it possible to pin-point locations of the most rapid change, or when a threshold is
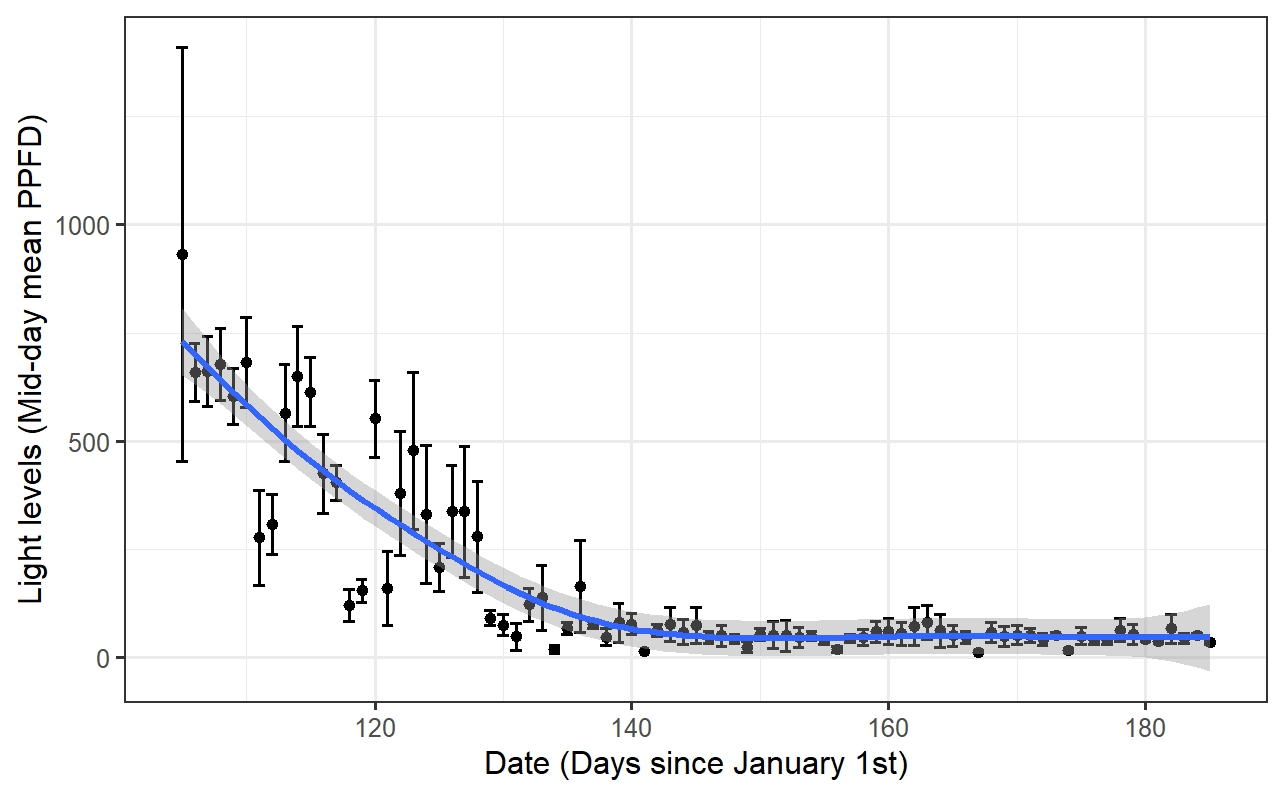
For a paper which collected light and photosynthesis data in a forest during the spring we needed to determine when we should considered the leaf emergence of the trees finished and the canopy "closed."
The plot below shows how average daily light levels changed over time, with a GAM smooth fit to the data.
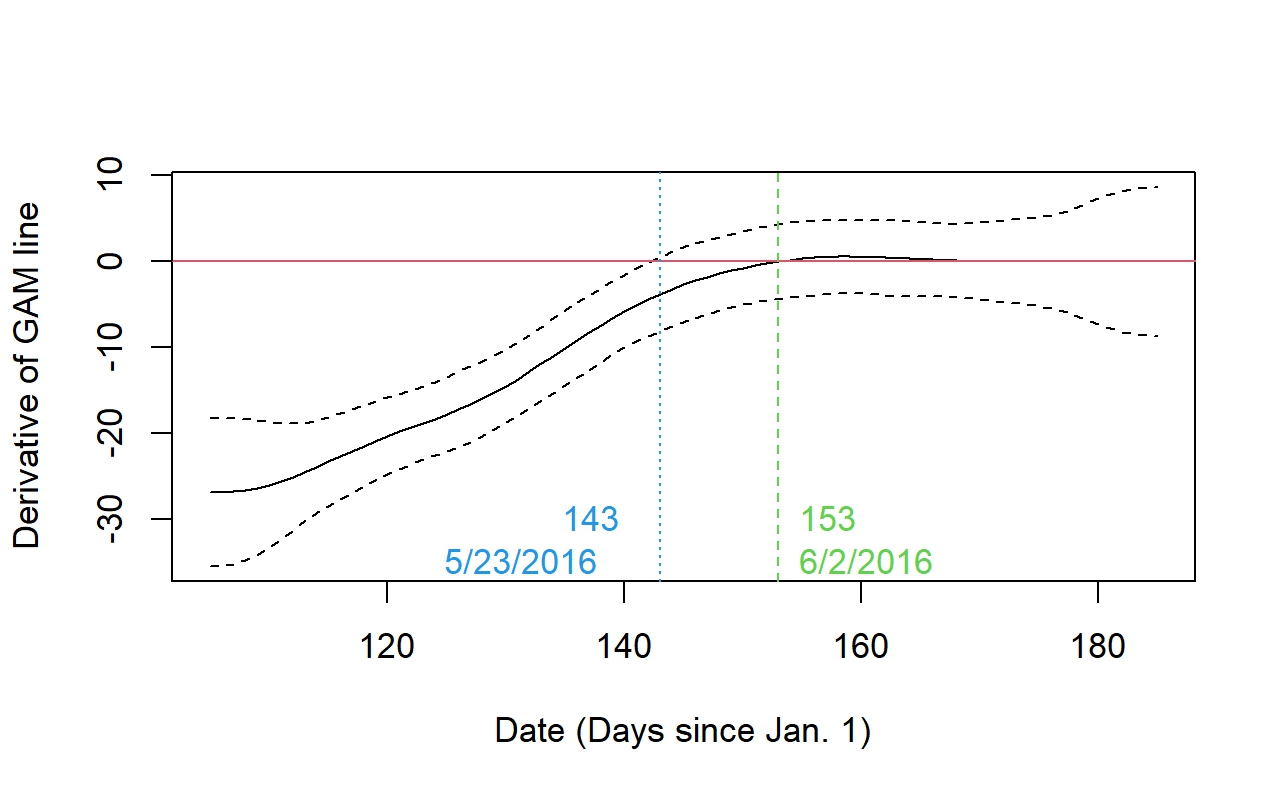
To determine when light levels were no longer changing, I adapted GAM derivative techniques discussed by Gavin Simpson on his blog. Often this is done arbitrarily, but we wanted to provided a justifiable and quantitative cutoff.
The figure below shows how the derivative for the smoother in the previous plot changes over time.