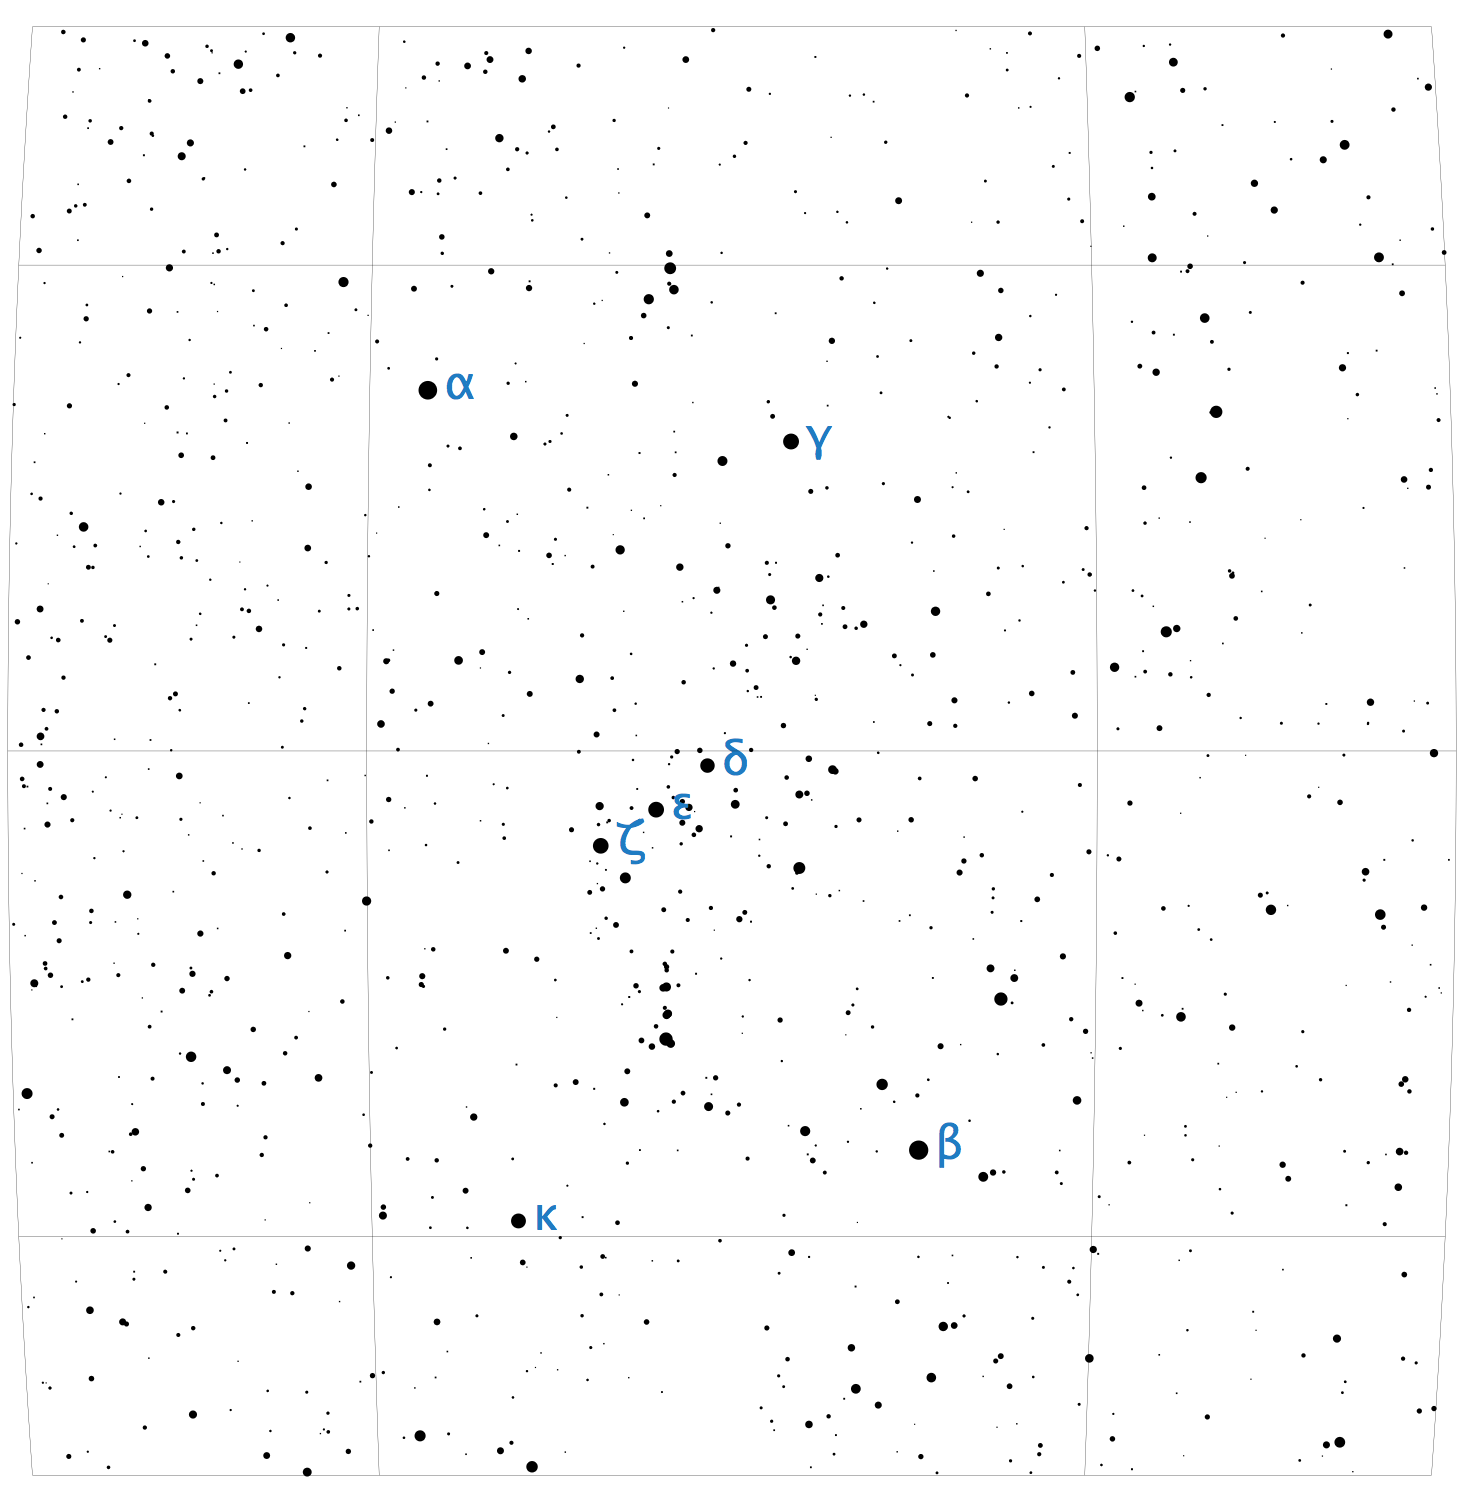
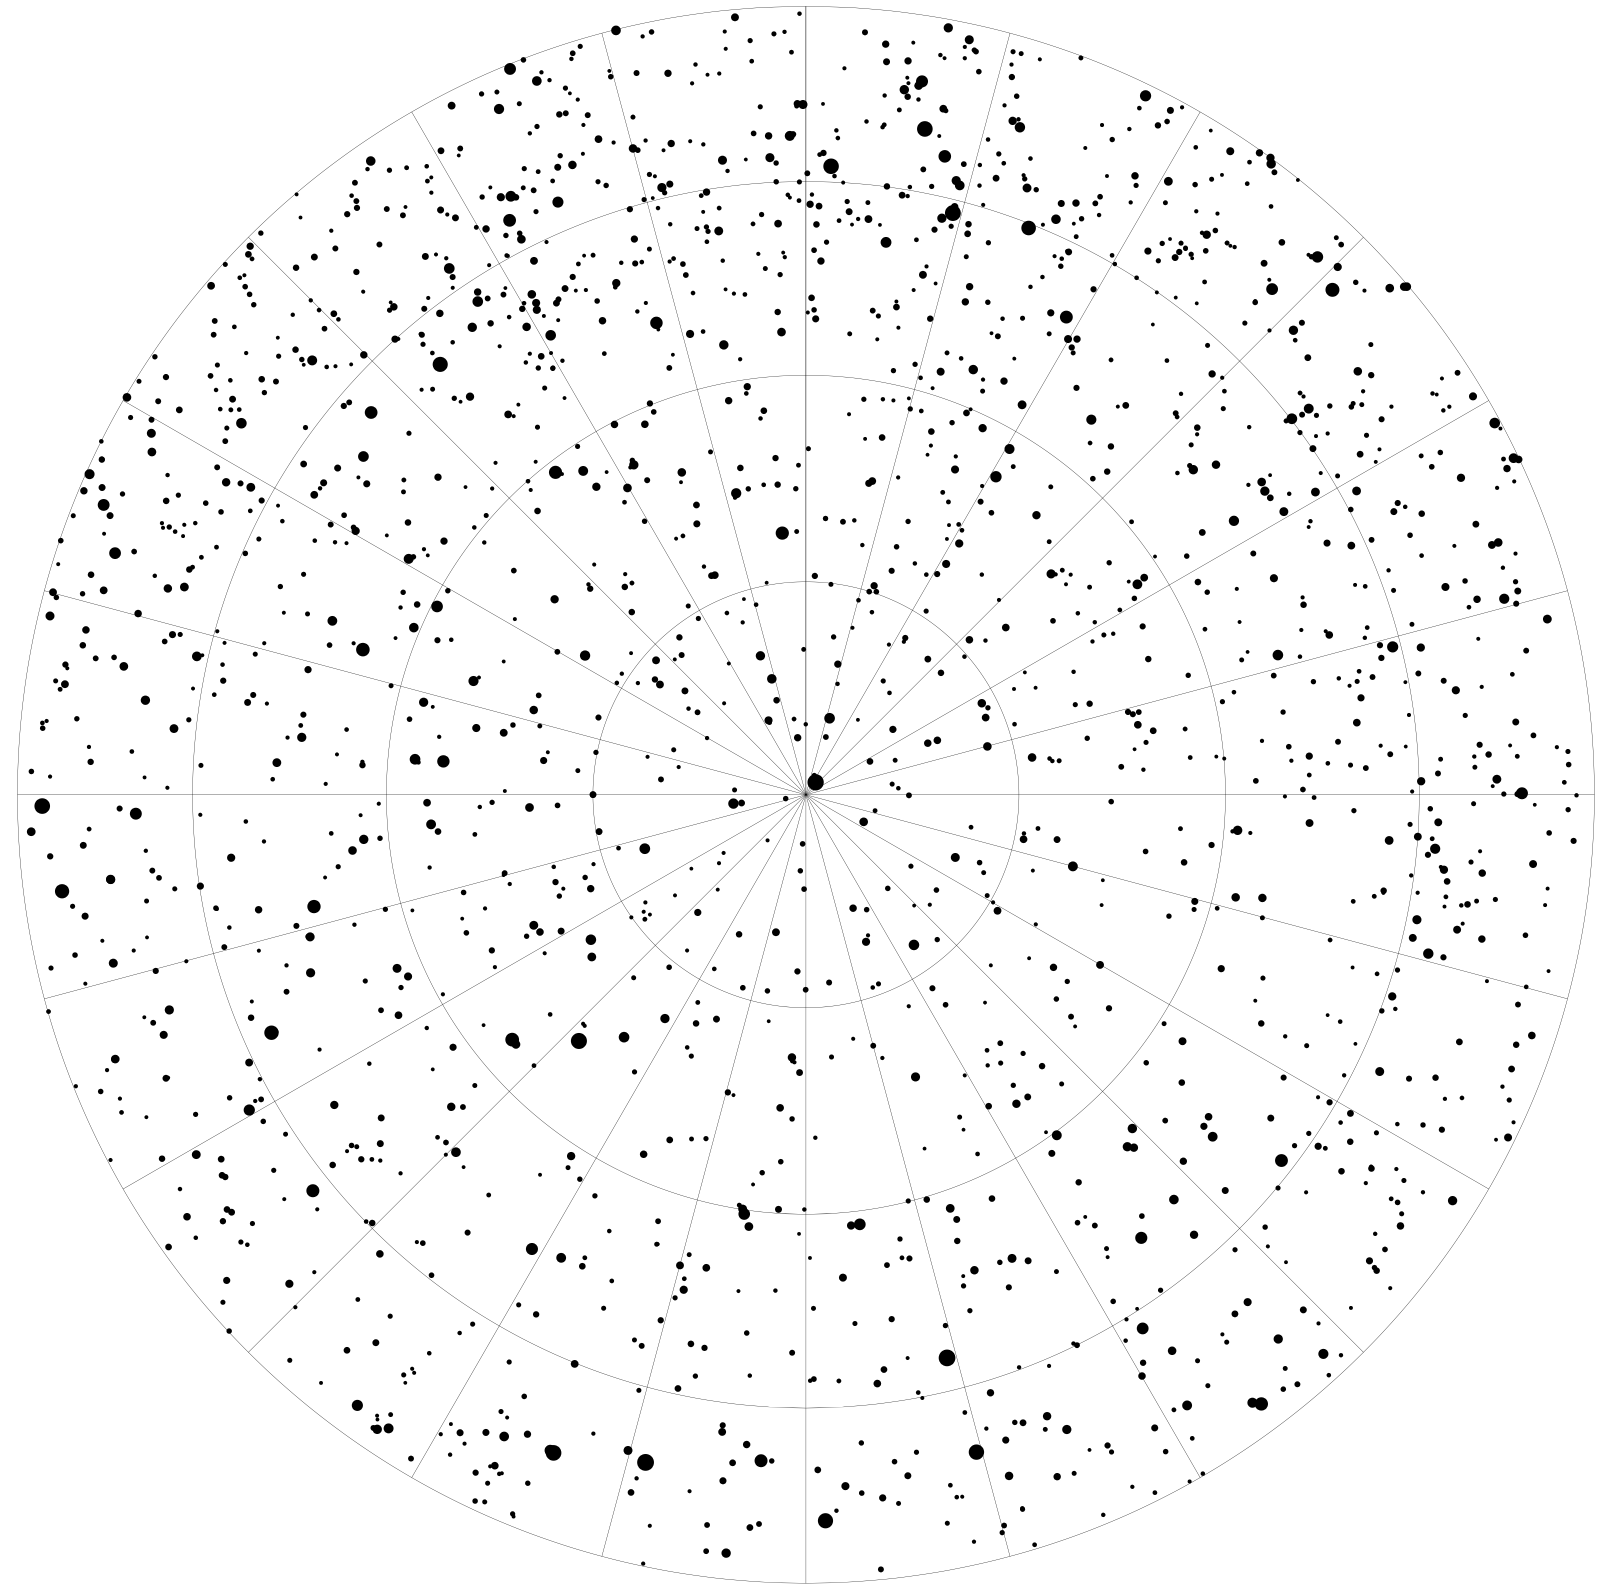
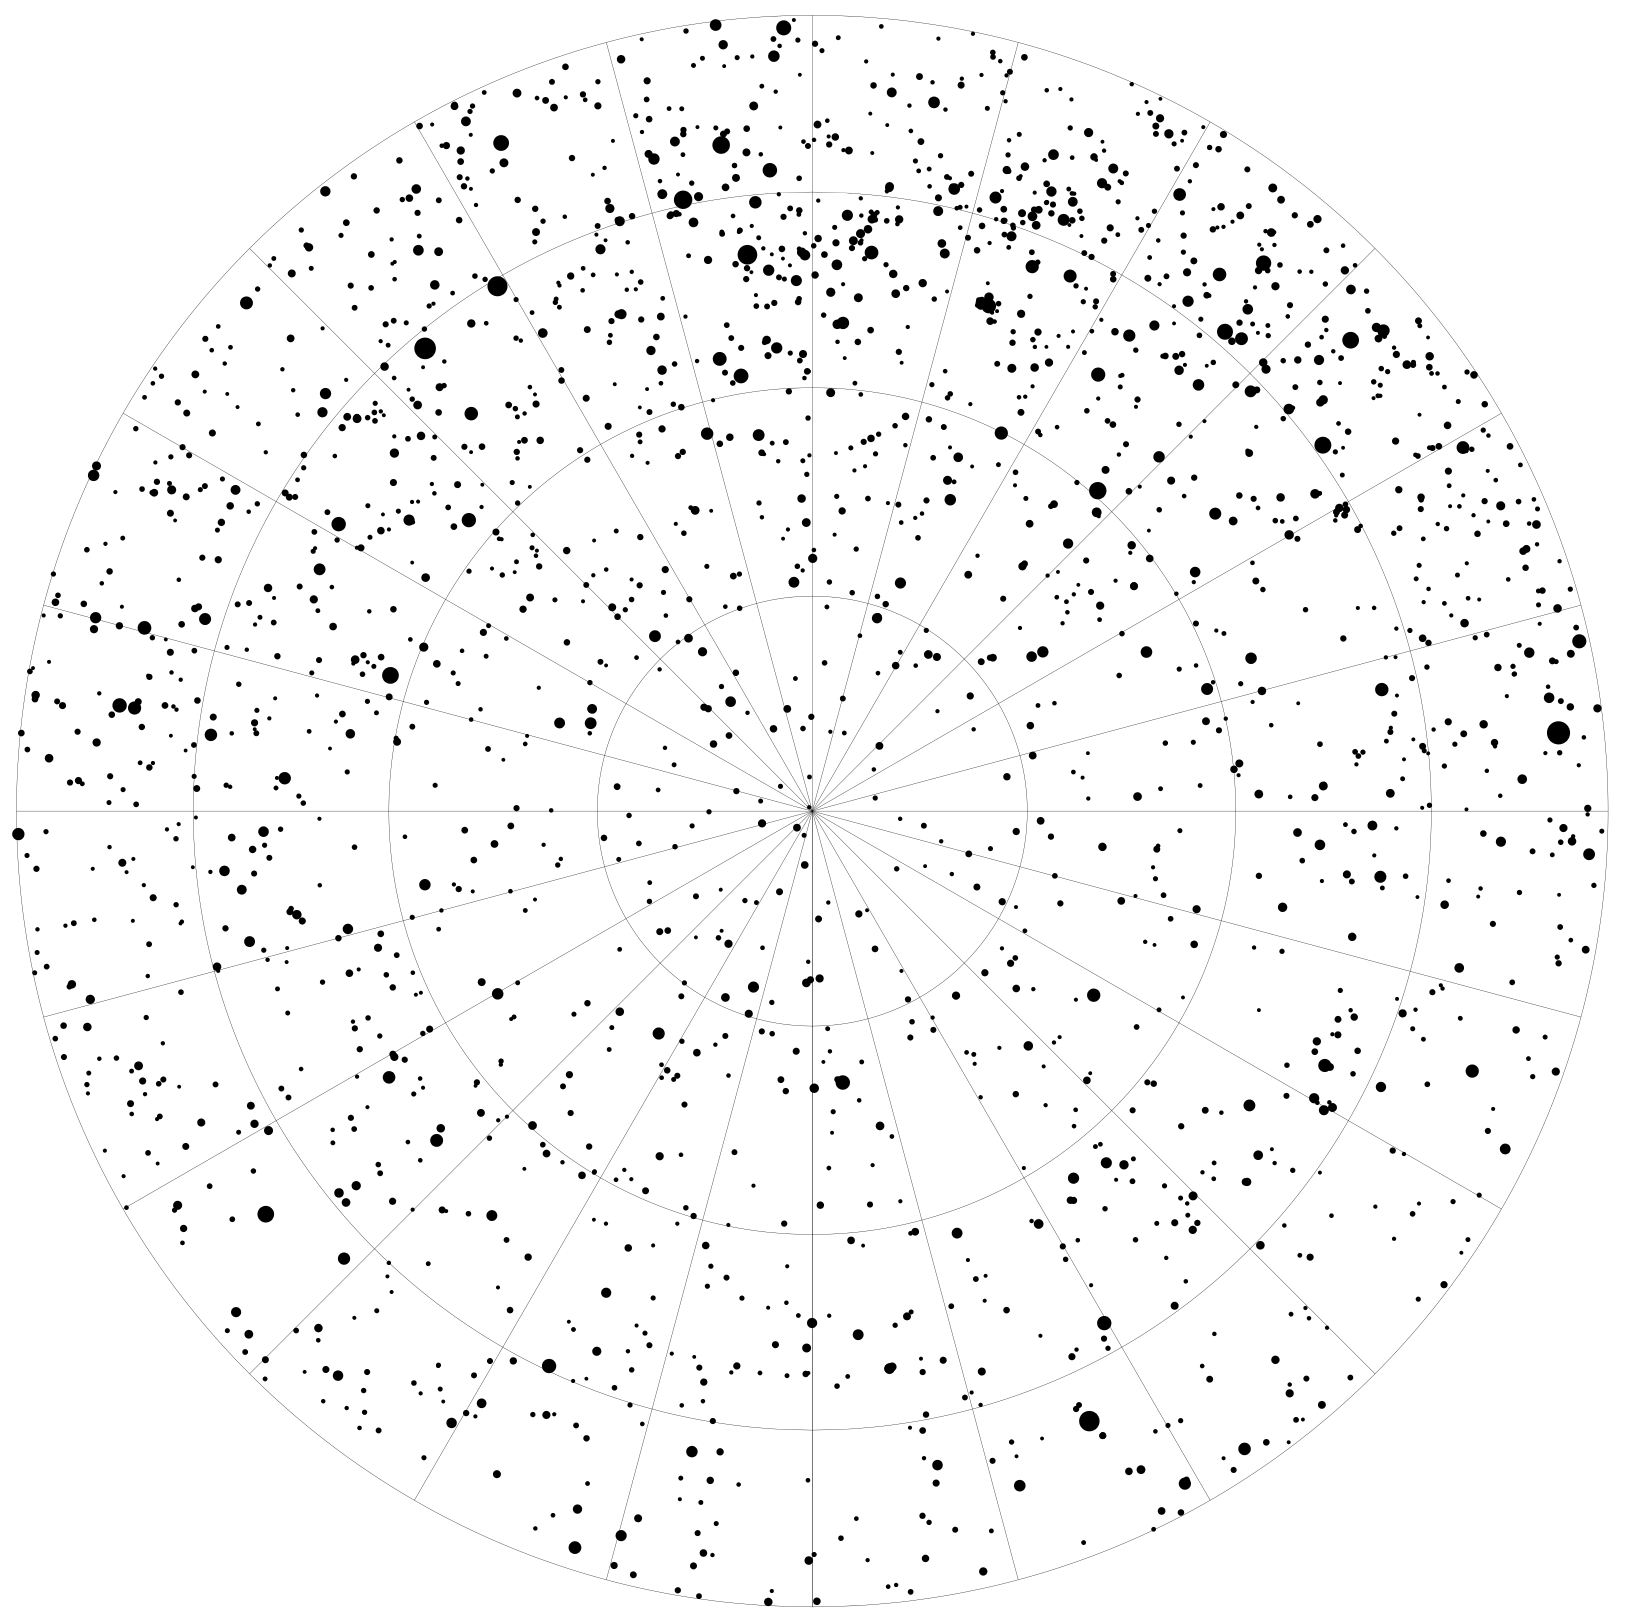
This Python script will generate SVG star charts, like the ones shown below:
The constellation Orion, showing stars down to magnitude 8 original SVG
The script reads data about the position and brightness of stars from a CSV file like this one. Each row in the CSV file contains information about a single star in 4 columns as follows:
- Right-Ascension: the star's angular distance eastward from the vernal equinox (0 to 24)
- Declination: the star's angular distance northward from the celestial equator (-90 to +90)
- Magnitude: the star's brightness
- Label: an optional field used to add labels to stars (see the Greek letters in the example chart above)
For example
5.91937636,+76.86957095, 8.07
5.91952477,+07.40703634, 0.45,α
5.92011402,+61.86673905, 8.60
5.92045102,-73.15075170, 7.72
The area to be covered by the chart is specified using a SkyArea object, which must be referenced the main.py file. A few pre-defined areas are included, such as complete northern and southern sky maps:
Maps of the Northern and Southern skies, showing stars down to magnitude 7 (original SVGs: North and South
The script is run by simply executing the main.py file, as follows:
python main.py
The SVG file will be created in the current directory, and will be named star-chart.svg
Please note that the script is designed to be run using Python 3, it will not run correctly with Python 2.


