This README outlines the details of collaborating on this Ember addon.
ember install ember-cli-piechart
{{pie-chart data=model height=100 width=100}}
where data is an array of {"value", "color"}. height and width of canvas is optional.
A valid data might look like this:
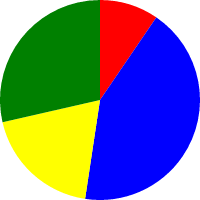
var data = [
  {"value": 1, "color": "red"},
  {"value": 4.5, "color": "blue"},
  {"value": 2, "color": "yellow"},
  {"value": 3, "color": "green"}
];
which will render a pie chart in a canvas like this:
git clone <repository-url>this repositorycd ember-cli-piechartnpm installbower install
ember serve- Visit your app at http://localhost:4200.
npm test(Runsember try:eachto test your addon against multiple Ember versions)ember testember test --server
ember build
For more information on using ember-cli, visit http://ember-cli.com/.