# Defaul : ./metro_rush.py delhi-metro-stations
# choice algorithm : ./metro_rush.py --algo [0, 1] delhi-metro-stations
# Graphics : ./metro_rush.py delhi-metro-stations --gui
Here is the second project about graphs and object-oriented!
You get familiarized with graphs data structure and object-oriented in the last project. Perfect! Time to move the next level. Be ready, folks!
A transit map is a topological map of a public transport system. It is composed of lines, stations, and transfer points. A line connects several stations in a direct route from a first station to an end station. A transfer point is a station that is crossed by two or more lines. A transfer point allows passengers to change from a line to one other.
The current project requires you to find the smallest number of turns that is required for all the trains to move from a specified station (start point) to another specified station (end point).
There are a few constraints you have to respect:
-
there can be only one train at a given station, except at the specified start and end points;
-
all the trains can move during a turn;
-
a train can move from a station to only one connected station of the current line during one turn;
-
a train can switch from a line to another at a transfer point during one turn;
-
a train can move from a station to another or it can switch from a line to another during one turn; it cannot do both during one turn.
You will write a Python script, name metro_rush.py, which takes a filename as an argument. This file contains a list of metro lines and metro stations of the following form:
#<line_name>
1:<station_name>
2:<station_name>
3:<station_name>
(…)
#<line_name>
1:<station_name>
2:<station_name>
3:<station_name>
(…)

START=<line_name>:<station_id>
END=<line_name>:<station_id>
TRAINS=n
Where:
-
where all stations in a line are connected in the order of their IDs. A station that has two or more lines passing through will appear with the same name in all lines.
-
a circular line will have the first and last ID with the same name.
-
all trains will get their own label Tx (where x has a unique value between 1 and n).
-
if the file is improperly formatted, your program will output "Invalid file" on stderr before exiting.
To visualize the result, the program will print the state of the network at each turn in the following way: for each occupied station, print <station_name>(<line_name>:<station_id>)-<train_label>
Example:
Subhash Nagar(Blue Line:17)-T9,T8,T7|Tagore Garden(Blue Line:18)-T6|Rajouri Garden(Blue Line:19)-T5|Ramesh Nagar(Blue Line:20)-T4|Moti Nagar(Blue Line:21)-T3,T2,T1Note: Blue Line:17 & Blue Line:21 can have more than one train because they are START and END stations, other stations can only have one train at a time.
The program stops when all trains have reached the end station.
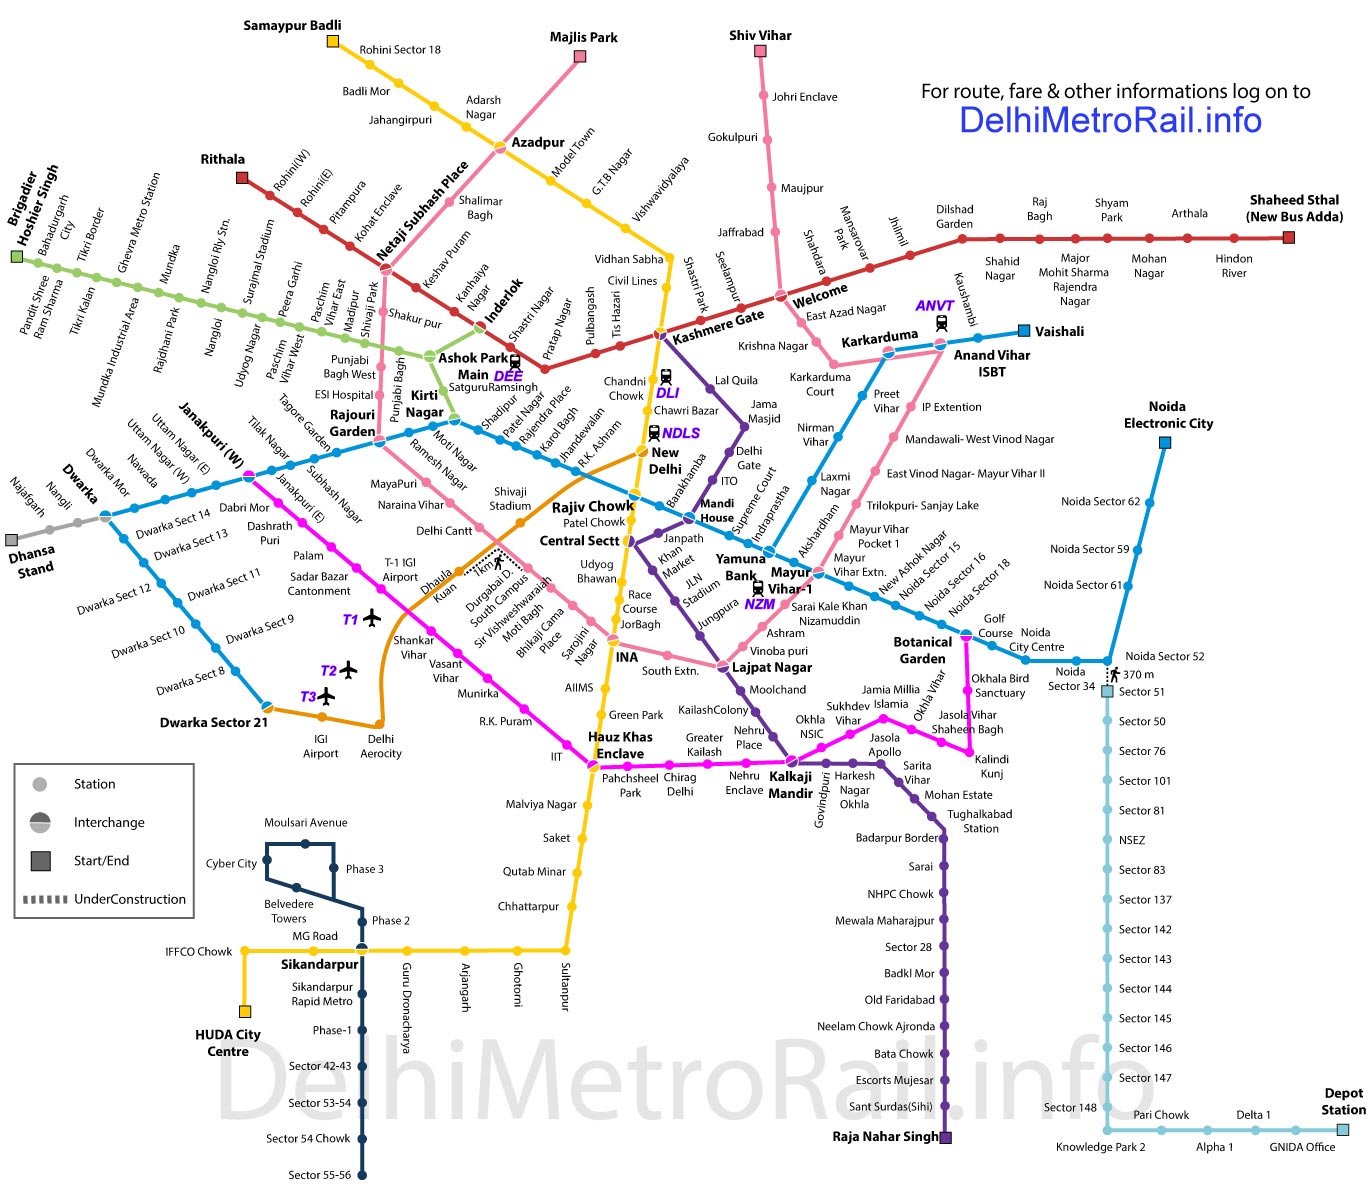
Below is the picture of Delhi Metro network and example metro stations file that contain part of it. It's just for example, you can use this or other city metro map to create the metro stations file.
Source link:
https://delhimetrorail.info/delhi-metro-map
https://delhimetrorail.info/delhi-metro-stations
For the core part of the project, you're required moving at least 30 trains at a time from start station to end station without error or hanging your machine (maximum calculating time is 2 min)
There is no Sentinel for this project, as you are free in the choice of algorithms. Checking that you follow the constraint and the trains not skip any station in it path is trivial.
However, and as usual, you will have to demonstrate your understanding of the algorithms you implemented during the review.
For the bonus part, you will implement several algorithms calculating the smallest number of turns for the trains. As many as you want, each implementation will get you points... as long as you understand the algorithm!
You will modify your metro_rush.py program so that it accepts an option specifying the algorithm the program will run with to find the solution.
Another big challenge for you: can you visualize the Metro Network as seen in the Tranport Map picture with Pyglet?
-
The positions of the stations and the lines not necessary 100% like in the real world.
-
The trains and it movement between stations must be visualize too. (you should only use a color dot with the train label to represent a train)
