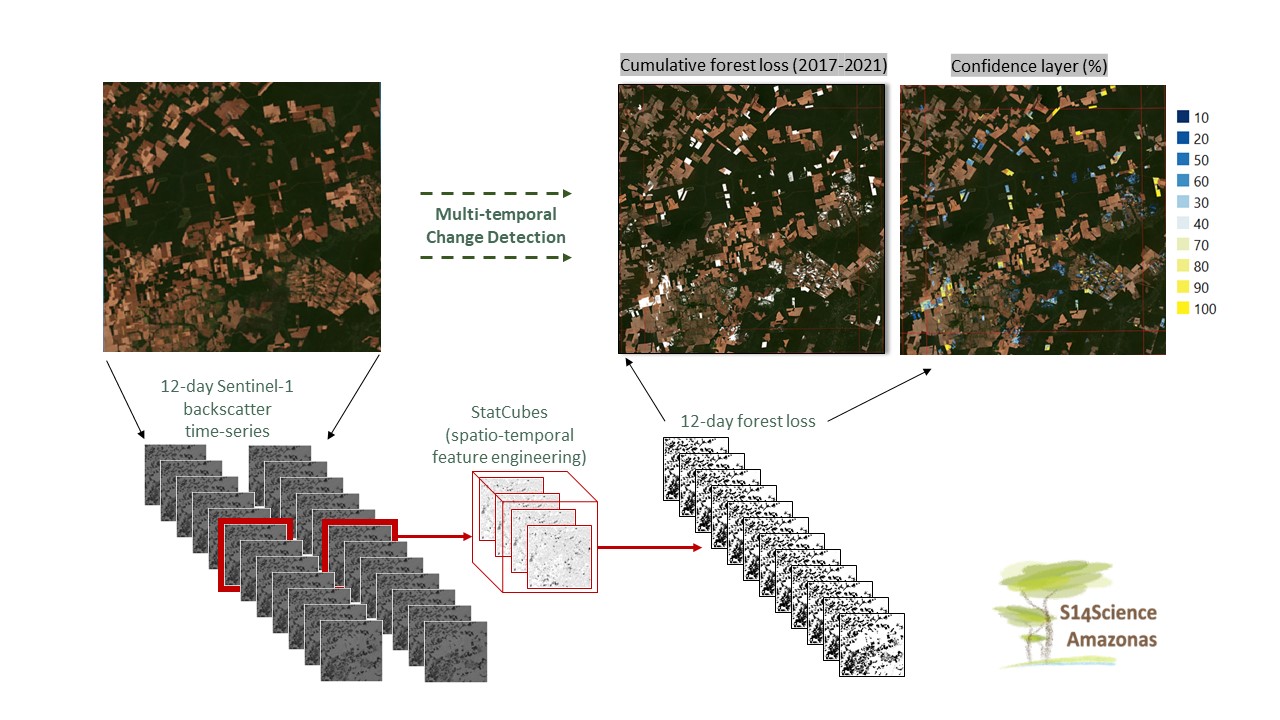
 Script repositorty for ESA s14amazonas project.
It is strongly recommended to use ANACONDA and git.
- Python version 3.7 or higher
numpy,scipy,gdal,osgeo,ogr,osr,pandas
The command to run each script is given in the header of the script. Download the supporting data needed for the scripts from the link (https://www.dropbox.com/sh/353unqp9a76xqts/AAB_Qa6DH7vpl41bJefn15eka?dl=0) and place it in a directory. The supporting data is in the aux_data directory. The results of each script are stored in the output. The area of interest, for which the deforestation detection is needed, is given as a multipolygon/polygon string as one of the arguments for the scripts. For example, a Sentinel-2 tile extent(https://eatlas.org.au/data/uuid/f7468d15-12be-4e3f-a246-b2882a324f59), which is the area of interest, can be given as the input.
Pre-processed backscatter scenes are grouped and mosaicked in 12-day intervals based on the observation date. Such mosaics are made for each polarization of data in each orbit direction (i.e. ascending and descending). The 12-day mosaics are alinged to each other, each containing the same number of pixel rows x columns.
The above-generated mosaics are stacked and various calculations are done on a moving-window across the stack. For example, the difference in means in stacks of 10 past images and 10 future images are calculated, the R2 and p-value of the slope of a linear trend on the stack is calculated etc. These output rasters are referred to as ‘StatCubes’.
The above-generated ‘StatCubes’ can then be used in multiple ways (e.g. simple thresholding, decision-tree, random-forest or deep learning approaches) to detect deforestation events. Here, a simple-thresholding approach, with user-defined thresholds, is demonstrated.
- A byte of Python: A good introductory tutorial to Python.
- Introduction to Python Programming: It covers basics of Python programming, including data types, control structures, and functions.
- Python for Everybody: It covers basics of programming and data analysis.