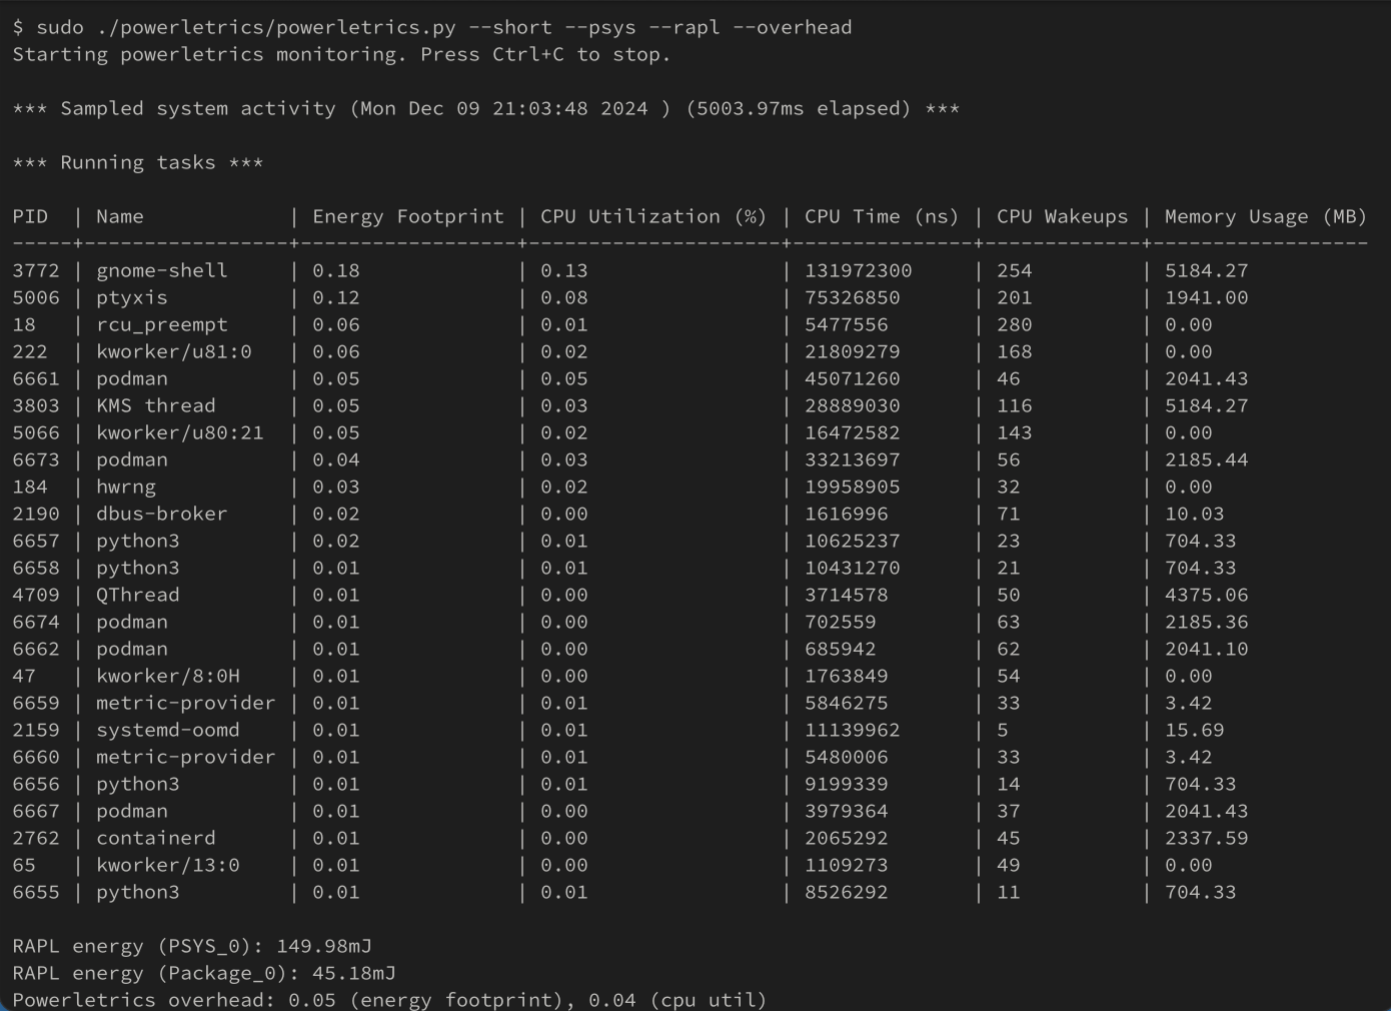
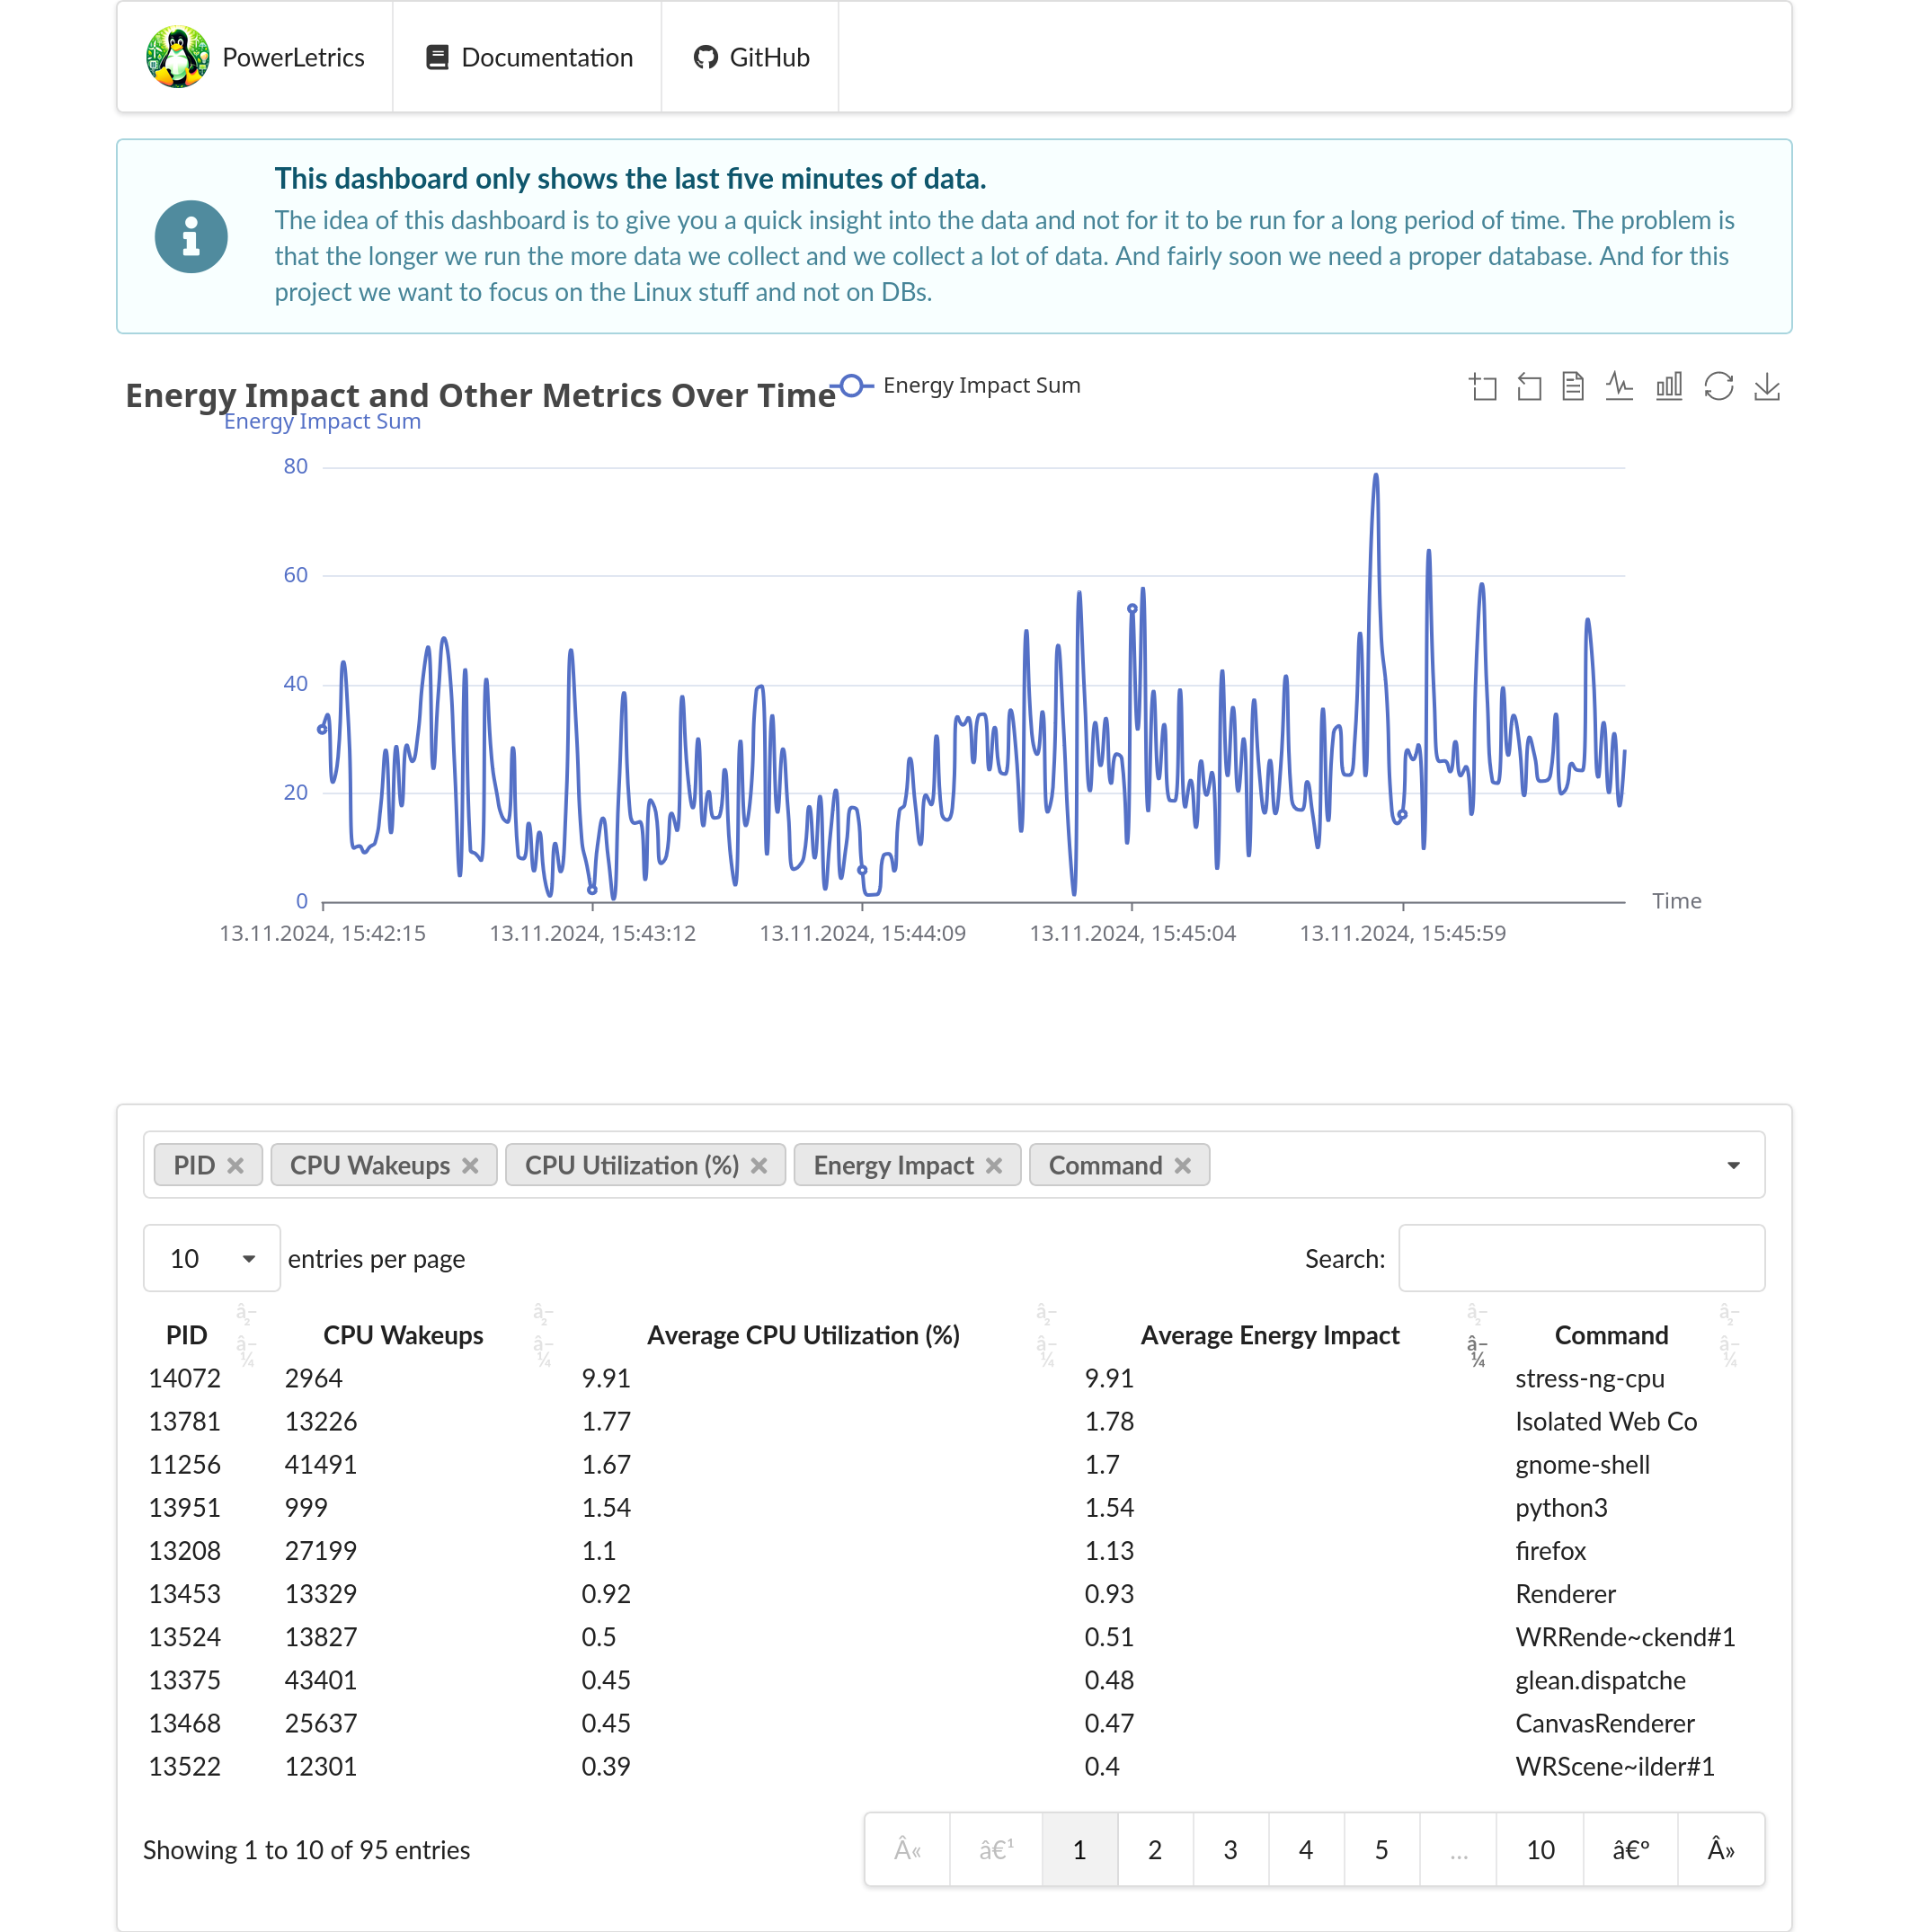
PowerLetrics is an open-source framework designed to monitor and analyze power consumption metrics at the process level on Linux. Similar to how top displays memory or CPU time, PowerLetrics provides the "Energy Footprint" of each process in real-time. This project is still in the early stages of development. Please test it and submit any issues.
This project is heavily influenced by the powermetrics program on macOS.
- You need to install bcc on your system which should include all the python bindings https://github.com/iovisor/bcc/blob/master/INSTALL.md
- Ubuntu:
sudo apt-get install bpfcc-tools linux-headers-$(uname -r)or check out https://github.com/iovisor/bcc/blob/master/INSTALL.md#ubuntu---source - Fedora:
sudo dnf install bcc - RHEL:
yum install bcc-tools
-
You can then install the program with
pip install powerletrics. Please note that if you are using avenvyou will need to create it with--system-site-packagesas otherwise we don't have access to the bcc libs -
If you want to use RAPL and PSYS data you need to build the binaries. You will need
gccandmakeon your system. PowerLetrics will try and build everything on the first run for you. -
You can then run the program from the shell:
powerletrics -i 1000 --shortyou can also start a little server with
powerletrics -sIf this list is scary long you might want to try the --short parameter which removes everything with an energy footprint of smaller than 0.01.
There is also the option to get the CPU energy from RAPL. You can activate this with --rapl.
If your computer support it you can also get the PSYS energy with --psys.
We don't enable this by default as we want to make the program runnable in a VM so people can test it easily and we want the default to work in all environments.
If you want to use this feature you will need to install gcc on your machine and build the tools with make
-i/--sample-rate: Specifies the time interval (in milliseconds) between samples. The program will capture data at this interval. For example, a value of 5000ms means data will be collected every 5 seconds. Default: 5000 (milliseconds)-n/--sample-count: Defines how many samples to take before the program stops. If set to 0, the program will continue to sample indefinitely until manually stopped. Default: 0 (infinite)-o/--output-file: If specified, the output will be written to the provided file instead of the standard output (console).-r/--order: Sets the sorting method for the displayed process list. Default:composite- Choices:
pid: Sort by process ID.wakeups: Sort by the number of CPU wakeups.cputime: Sort by CPU time.composite: Sort by the composite energy footprint (a weighted combination of several factors, like CPU, memory, and disk usage).
- Choices:
-A/--show-all: Enables all available samplers and shows all the information from each one. This includes process energy footprint, I/O stats, and network stats.--show-process-io: Displays per-process I/O statistics, such as disk read and write bytes.--show-process-netstats: Displays per-process network statistics, including the number of received and transmitted network packets.--show-command-line: Displays the full command-line arguments for each process.--short: There are a lot of processes that don't really incur a lot of impact (energy footprint is 0.0). So we can remove them so that the list does't get too long.--format: Specifies the format in which the output will be displayed: Default:text- Choices:
text: Human-readable text format.plist: Property list (XML) format, useful for programmatic analysis.
- Choices:
--proc-memory: The default mode is to get memory using ebpf. If this doesn't work you can also use the memory from the proc filesystem. This will be slower as for every process we need to open the /proc file and parse it.-f/--flush: Forces flushing of the output after each print. This is useful when writing output to files or when immediate display is necessary.-c/--clear: Clears the shell on new data-s/--server: Start a webserver running @ http://localhost:9242 that displays data in nice HTML format with charts! Did we say charts already?!--port: The port to bind the webserver to. Default: 9242--host: The host to run the webserver on. Default:localhost. Use 0.0.0.0 if you want to listen to the whole world.--rapl: If you want to get the energy data from the CPU--psys: If you want to get the energy data for your machine--rapl-sample-rate: How often you want rapl and psys to get the data. Defaults to 500ms--overhead: Outputs the overhaed powerletrics has while running.--thread: Shows if the process is a thread (pid != tid)
When calculating the energy footprint each value is multiplied with a weight these are different for each machine. You
can modify them in the config.conf or /etc/powerletrics file.
This work has been funded by the Green Screen Catalyst Fund.
If you like this work and want to fund this please feel free to reach out.
macOS uses something that is called energy impact which we try to copy. But because we don't want to use the same term we call it energy footprint but it tries to be the same.
Execute this before starting the program
tput rmam
Because we use Total Virtual Memory instead of Resident Set Size
Only programs that have run are listed as they are the only ones that have actually used something.
Because it does the same things (yes we check) and is slower as it adds more overhead. We still 😍 psutil though.
If you have a large sample period and a lot is happening on your system the data structure we use to save the names of the processes might overflow and start overwriting itself. If this happens please set COMM_LENGTH to something larger in the config.conf.

