
(6) Running Interspec-EpiState-NMF
(7) Output of Interspec-EpiState-NMF pipeline
Interspec-EpiState-NMF is a user-friendly pipeline designed for identifying genomic regions with highly correlated cross-cell type epigenetic state patterns between gene locus pairs. This analysis, as detailed in our paper, caters to a variety of gene comparisons. It accommodates both orthologous gene pairs across different species and different or identical genes within the same species. The pipeline outputs include a heatmap visualizing the correlation of cross-cell type epigenetic state patterns between each gene locus pair. Additionally, it provides a set of Non-negative Matrix Factorization (NMF) decomposition factors along with their corresponding loading scores at the two genes' locus. Another feature of this pipeline is the introduction of a False Discovery Rate (FDR)-based method for identifying highly correlated regions between gene locus, utilizing a background distribution derived from randomly selected genes.
The Overview of the analysis about identifying genomic regions with highly correlated cross-cell type epigenetic state patterns between gene locus pairs are as follows:
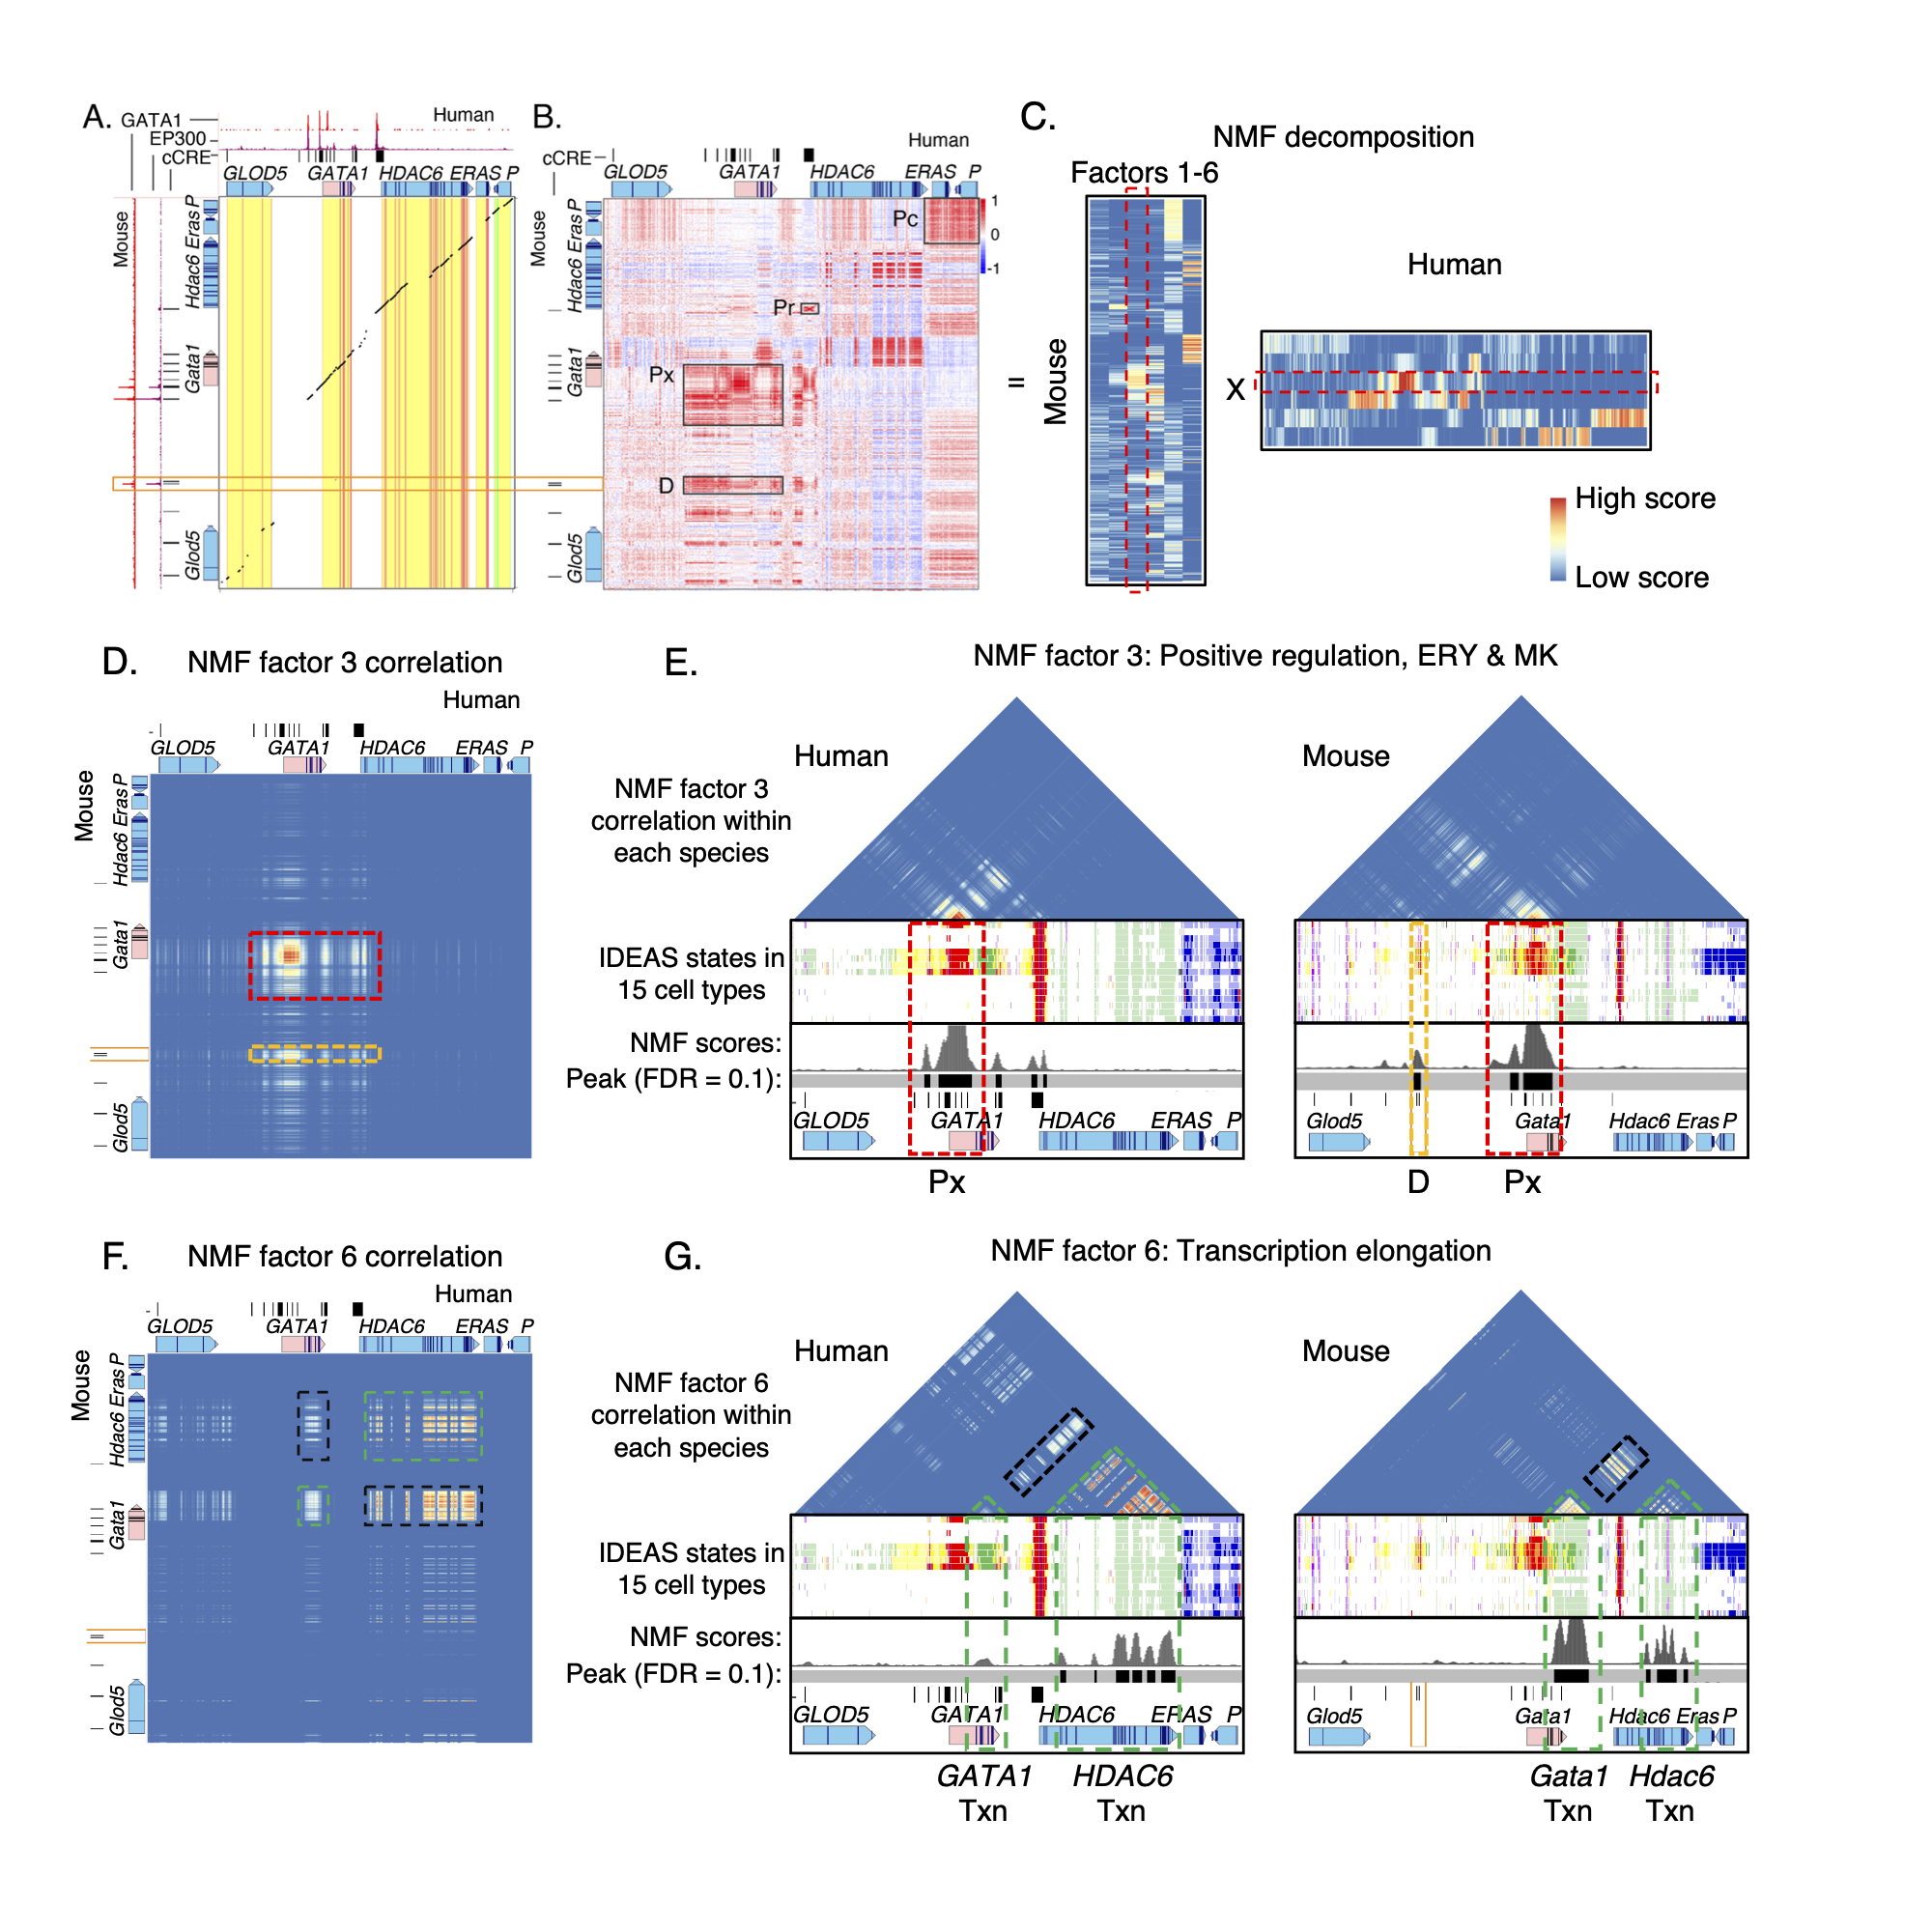
Epigenetic comparisons of regulatory landscapes and cCREs. (A and B) DNA sequence alignments and correlations of epigenetic states in human GATA1 and mouse Gata1 genes and flanking genes. (A) Dot-plot view of chained blastZ alignments by PipMaker (Schwartz et al. 2000) between genomic intervals encompassing and surrounding the human GATA1 (GRCh38 chrX:48,760,001-48,836,000; 76kb) and mouse Gata1 (mm10 chrX:7,919,401-8,020,800; 101.4kb, reverse complement of reference genome) genes. The axes are annotated with gene locations (GENCODE), predicted cis-regulatory elements (cCREs), and binding patterns for GATA1 and EP300 in erythroid cells. (B) Matrix of Pearson correlation values between epigenetic states (quantitative contributions of each epigenetic feature to the assigned state) across 15 cell types analogous for human and mouse. The correlation is shown for each 200bp bin in one species with all the bins in the other species, using a red-blue heat map to indicate the value of the correlation. Axes are annotated with genes and cCREs in each species. (C) Decomposition of the correlation matrix (panel B) into six component parts or factors using nonnegative matrix factorization. (D-G) Correlation matrices for genomic intervals encompassing GATA1/Gata1 and flanking genes, reconstructed using values from NMF factors. (D and E) Correlation matrices using values of NMF factor 3 between human and mouse (panel D) or within human and within mouse (panel E). The red dashed boxes highlight the positive regulatory patterns in the GATA1/Gata1 genes, which exhibit conservation of both DNA sequence and epigenetic state pattern. The orange dashed box denotes the distal positive regulatory region present only in mouse, which shows conservation of epigenetic state pattern without corresponding sequence conservation. Beneath the correlation matrices in panel E are maps of IDEAS epigenetic states across 15 cell types, followed by a graph of the score and peak calls for NMF factor 3 and annotation of cCREs (thin black rectangles) and genes. (F and G) Correlation matrices using values of NMF factor 6 between human and mouse (panel F) or within human and within mouse (panel G). The green dashed boxes highlight the correlation of epigenetic state patterns within the same gene, both across the two species and within each species individually, while the black dashed boxes highlight the high correlation observed between the two genes GATA1 and HDAC6.
Guanjue Xiang, ..., Ross Hardison. Interspecies regulatory landscapes and elements revealed by novel joint systematic integration of human and mouse blood cell epigenomes. (2023)
- bedtools
- R
- R Packages: pheatmap
# create conda environment for JMnorm with required dependencies
conda config --add channels bioconda
conda create -n esnmf r r-pheatmap bedtools

# activate the environment
conda activate esnmf
- The input files
# list all input files
>>> cd /Path_to_Interspec-EpiState-NMF/input_files/
>>> ls
IDEAS.EpigeneticState.mean_signal_mat.txt
config.info.txt
S3V2_IDEAS_hg38_r3_withHg38Mm10prior.state.matched_ct.bed
S3V2_IDEAS_mm10_r3_withHg38Mm10prior.state.matched_ct.bed
hg38.gene.bed
mm10.gene.bed
- The details about the input files can be found Here:
- We have prepared a short video about how to run the Interspec-EpiState-NMF pipeline Here.
# activate the environment
conda activate esnmf

# mkdir and cd to working_dir
mkdir ~/projects/analysis/test_cormat_NMF_FDR_pipeline_GATA1_Gata1/
cd ~/projects/analysis/test_cormat_NMF_FDR_pipeline_GATA1_Gata1/

# run Interspec-EpiState-NMF pipeline
time bash /Path_to_Interspec-EpiState-NMF/Interspec-EpiState-NMF.sh /Path_to_Interspec-EpiState-NMF/input_files/config.info.txt 2> test_run.log.txt
>>> ls /Users/guanjuexiang/Documents/projects/analysis/test_cormat_NMF_FDR_pipeline_GATA1_Gata1
GATA1.Gata1.cor.heatmap.png		hg38.gene.GATA1.matched_ct.state.bed
GATA1.Gata1.cor.heatmap.png.cor.mat.txt	mm10.gene.Gata1.bed
NMF_reconstruction_GATA1_Gata1		mm10.gene.Gata1.matched_ct.state.bed
config.info.txt				randomly_pick_bg_genes_hg38
hg38.gene.GATA1.bed			randomly_pick_bg_genes_mm10

>>> ls /Users/guanjuexiang/Documents/projects/analysis/test_cormat_NMF_FDR_pipeline_GATA1_Gata1/NMF_reconstruction_GATA1_Gata1
GATA1.Gata1.NMFs.num.BIC.pdf				GATA1.cor.mat.txt.NMFs.hg38.binary_FDRbgadj.txt
GATA1.Gata1.cross_factor_cor_mat.pdf			Gata1.NMFs.num.BIC.pdf
GATA1.Gata1.cross_factor_cor_mat.txt			Gata1.cor.heatmap.png.cor.mat.txt.NMFs.mm10.heatmap.png
GATA1.cor.heatmap.png.cor.mat.txt.NMFs.hg38.heatmap.png	Gata1.cor.mat.txt.NMFs.mm10.binary_FDRbgadj.heatmap.png
GATA1.cor.mat.txt.NMFs.hg38.binary_FDRbgadj.heatmap.png	Gata1.cor.mat.txt.NMFs.mm10.binary_FDRbgadj.txt
- The details about the output files can be found Here:
For questions or issues, please either create an issue on the GitHub repository or feel free to reach out via the following email addresses: guanjuexiang@gmail.com
This project is licensed under the GNU GENERAL PUBLIC License (Version >=2.0). See the LICENSE file for details.