-
Notifications
You must be signed in to change notification settings - Fork 46
PyTMatrix Kdp example
Jussi Leinonen edited this page Jan 8, 2014
·
1 revision
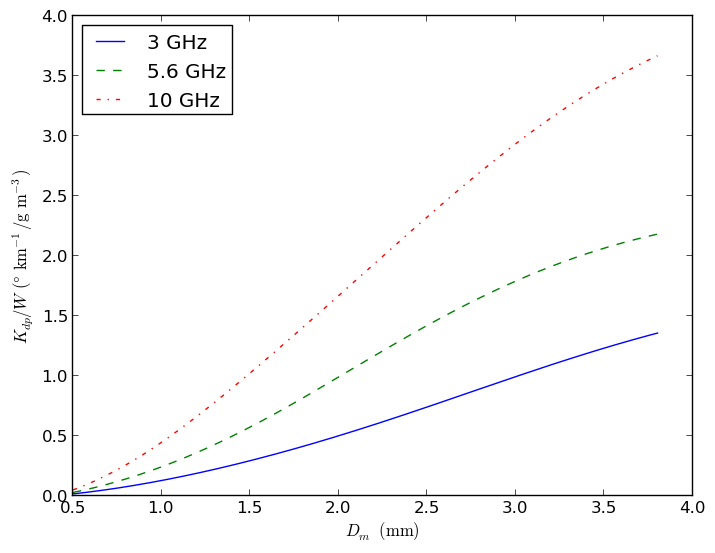
The code given below produces the following plot using PyTMatrix:

See also the examples on the main wiki page.
#!/usr/bin/env python

"""
This demo replicates Fig. 7.7 from Bringi and Chandrasekar (2001),
Polarimetric Weather Radar: Principles and Applications. It shows the
specific differential phase (Kdp) normalized by the total water content (W)
as a function of the mass-weighted mean diameter.
"""

from matplotlib import pyplot as plt
import numpy as np
from scipy import constants
from pytmatrix.tmatrix import Scatterer
from pytmatrix import psd, orientation, radar, tmatrix_aux


# define an exponential psd (eq. 7.12 with mu=0)
class ExponentialPSD(object):
    def __init__(self, lam=1.0, N0=1.0):
        self.lam = float(lam)
        self.N0 = float(N0)

    def __call__(self, D):
        return self.N0*np.exp(-self.lam*D)


# the Beard-Chuang axis ratio (eq. 7.3)
def axis_ratio(D):
    return 1.0/(1.0048 + 5.7e-4*D - 2.628e-2*D**2 + 3.682e-3*D**3 -
                1.677e-4*D**4)

# initialize a scatterer object
scatterer = Scatterer()
scatterer.set_geometry(tmatrix_aux.geom_horiz_forw)

# set up orientation averaging, Gaussian PDF with mean=0 and std=7 deg
scatterer.or_pdf = orientation.gaussian_pdf(7.0)  # orientation PDF
scatterer.orient = orientation.orient_averaged_fixed  # averaging method

# set up PSD integration
scatterer.psd_integrator = psd.PSDIntegrator()
scatterer.psd_integrator.D_max = 8.0  # maximum diameter considered
scatterer.psd_integrator.geometries = (tmatrix_aux.geom_horiz_forw,)
scatterer.psd_integrator.axis_ratio_func = axis_ratio

Dm = np.linspace(0.5, 3.8, 1000)  # range of Dm (mm)
lam = 4.0/Dm  # corresponding lambda parameters
W = np.pi*1e3*(Dm/4.0)**4  # corresponding water content

wavelengths = constants.c/np.array([3e9, 5.6e9, 10e9]) * 1e3  # in mm
ref_indices = [complex(8.983, 0.989), complex(8.590, 1.670),
               complex(7.718, 2.473)]
labels = ["3 GHz", "5.6 GHz", "10 GHz"]
styles = ["-", "--", "-."]


# this calculates Kdp for the given lambda parameter
def get_Kdp(lam):
    scatterer.psd = ExponentialPSD(lam=lam)  # set exponential PSD
    return radar.Kdp(scatterer)

plt.figure()
for (wl, m, label, style) in zip(wavelengths, ref_indices, labels, styles):
    scatterer.wavelength = wl
    scatterer.m = m
    # initialize lookup table
    scatterer.psd_integrator.init_scatter_table(scatterer)
    Kdp = np.array([get_Kdp(l) for l in lam])
    plt.plot(Dm, 1e6*Kdp/W, ls=style, label=label)  # 1e6 for unit conversion
plt.xlabel(r"$D_m$ $\mathrm{(mm)}$")
plt.ylabel(r"$K_{dp}/W$ $\mathrm{(\degree \, km^{-1} / g \, m^{-3})}$")
plt.legend(loc='best')