The scripts can be run directly from source code. Options can be adjusted in the code. Dependent libraries are installed automatically if missing.
Creates a publication ready genome map based on gff3 files and shows variants from SNPeff annotated vcf files. Comparison to reference vcfs is possible (difference/union).
Genome visualisation/genome_vis.RMultiple options let you explore the genome in more detail and customize the final plots:
The script takes two or more SNPeff annotated vcfs, extracted as tabular files to generate a heatmap of the variant frequencies: example input.
Rscript Heatmap/Heatmap.RThe script annotates genes and effects on the genes automatically based on the tabular files. Multiple options allow clustering, sorting and displaying the aminoacid changes in the mutation labels. The scripts can also selectively display variants that are over a desired frequency. Adjust options within the script if desired, otherwise default settings are used.
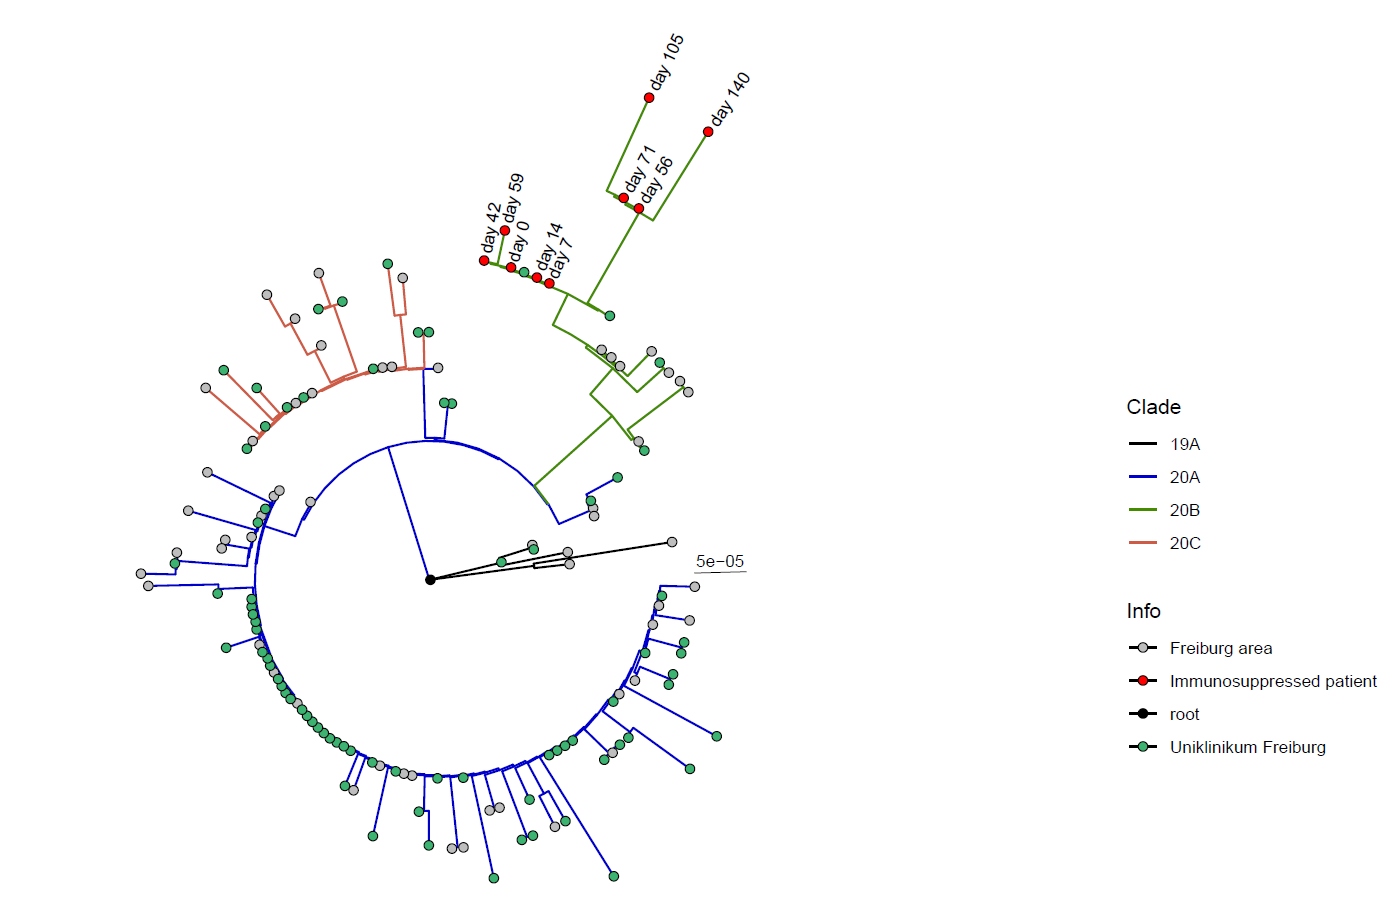
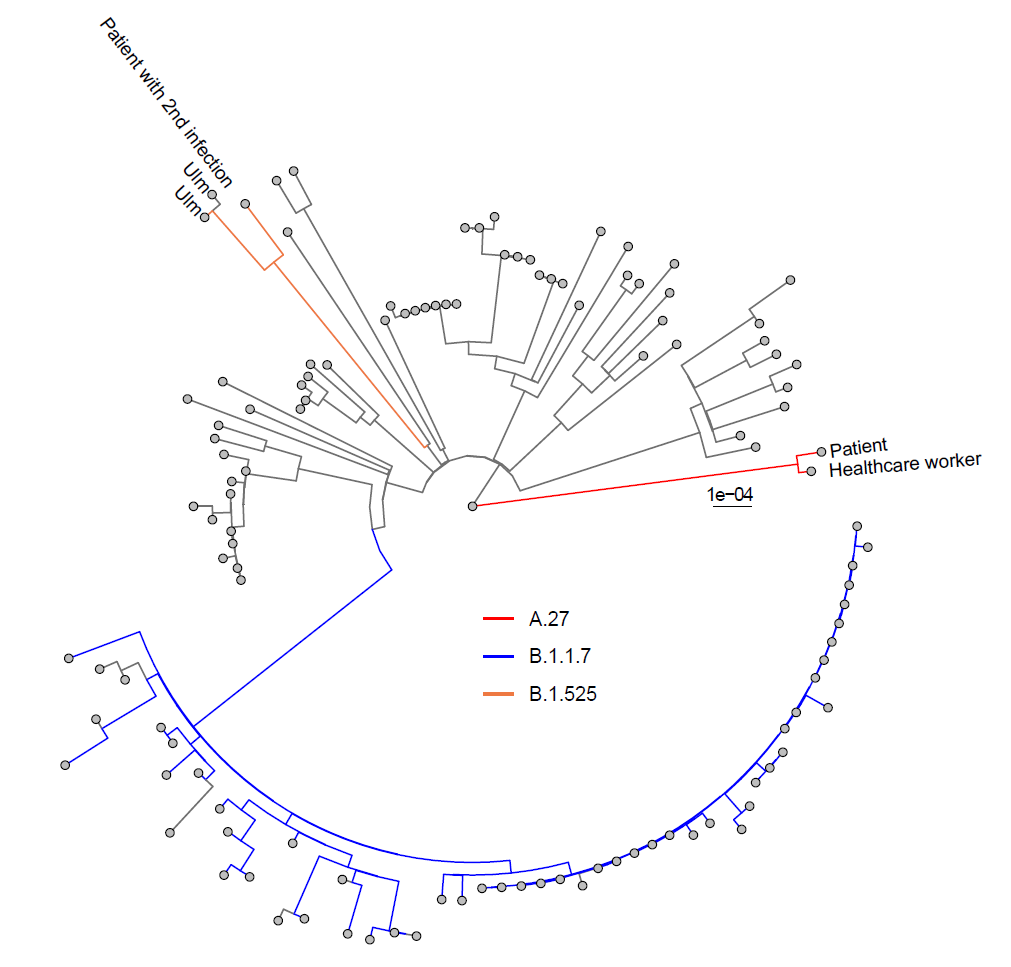
Vizualizes phylogenetic trees constructed with iqtree Tree.treefile. The script expects csv tables generated by pangolin (results.csv) or nextclade (nextclade.csv) classification and colors the branches accordingly. Furthermore, the tips can be colored according to additional information (info field) and the sequences name can be selectively displayed (display_names field), both on the basis of example input. Adjust options within the script if desired, otherwise default settings are used.
Tree clades/Tree_vis.RThe script allows you to root to a certain sequence and clades can be selectively displayed and colored.


