Citation: We are in the process of finding a journal for a manuscript describing the creation of this vulnerability index and will include a journal citation here when it is available. Our upcoming manuscript will include more information about the creation and potential applications of the index. Meanwhile, below is our citation on a preprint server:
Uong SP, Zhou J, Lovinsky-Desir S, et al. The Creation of a Multidomain Neighborhood Environmental Vulnerability Index. medRxiv. Published online January 1, 2022:2022.12.14.22283064. doi:10.1101/2022.12.14.22283064
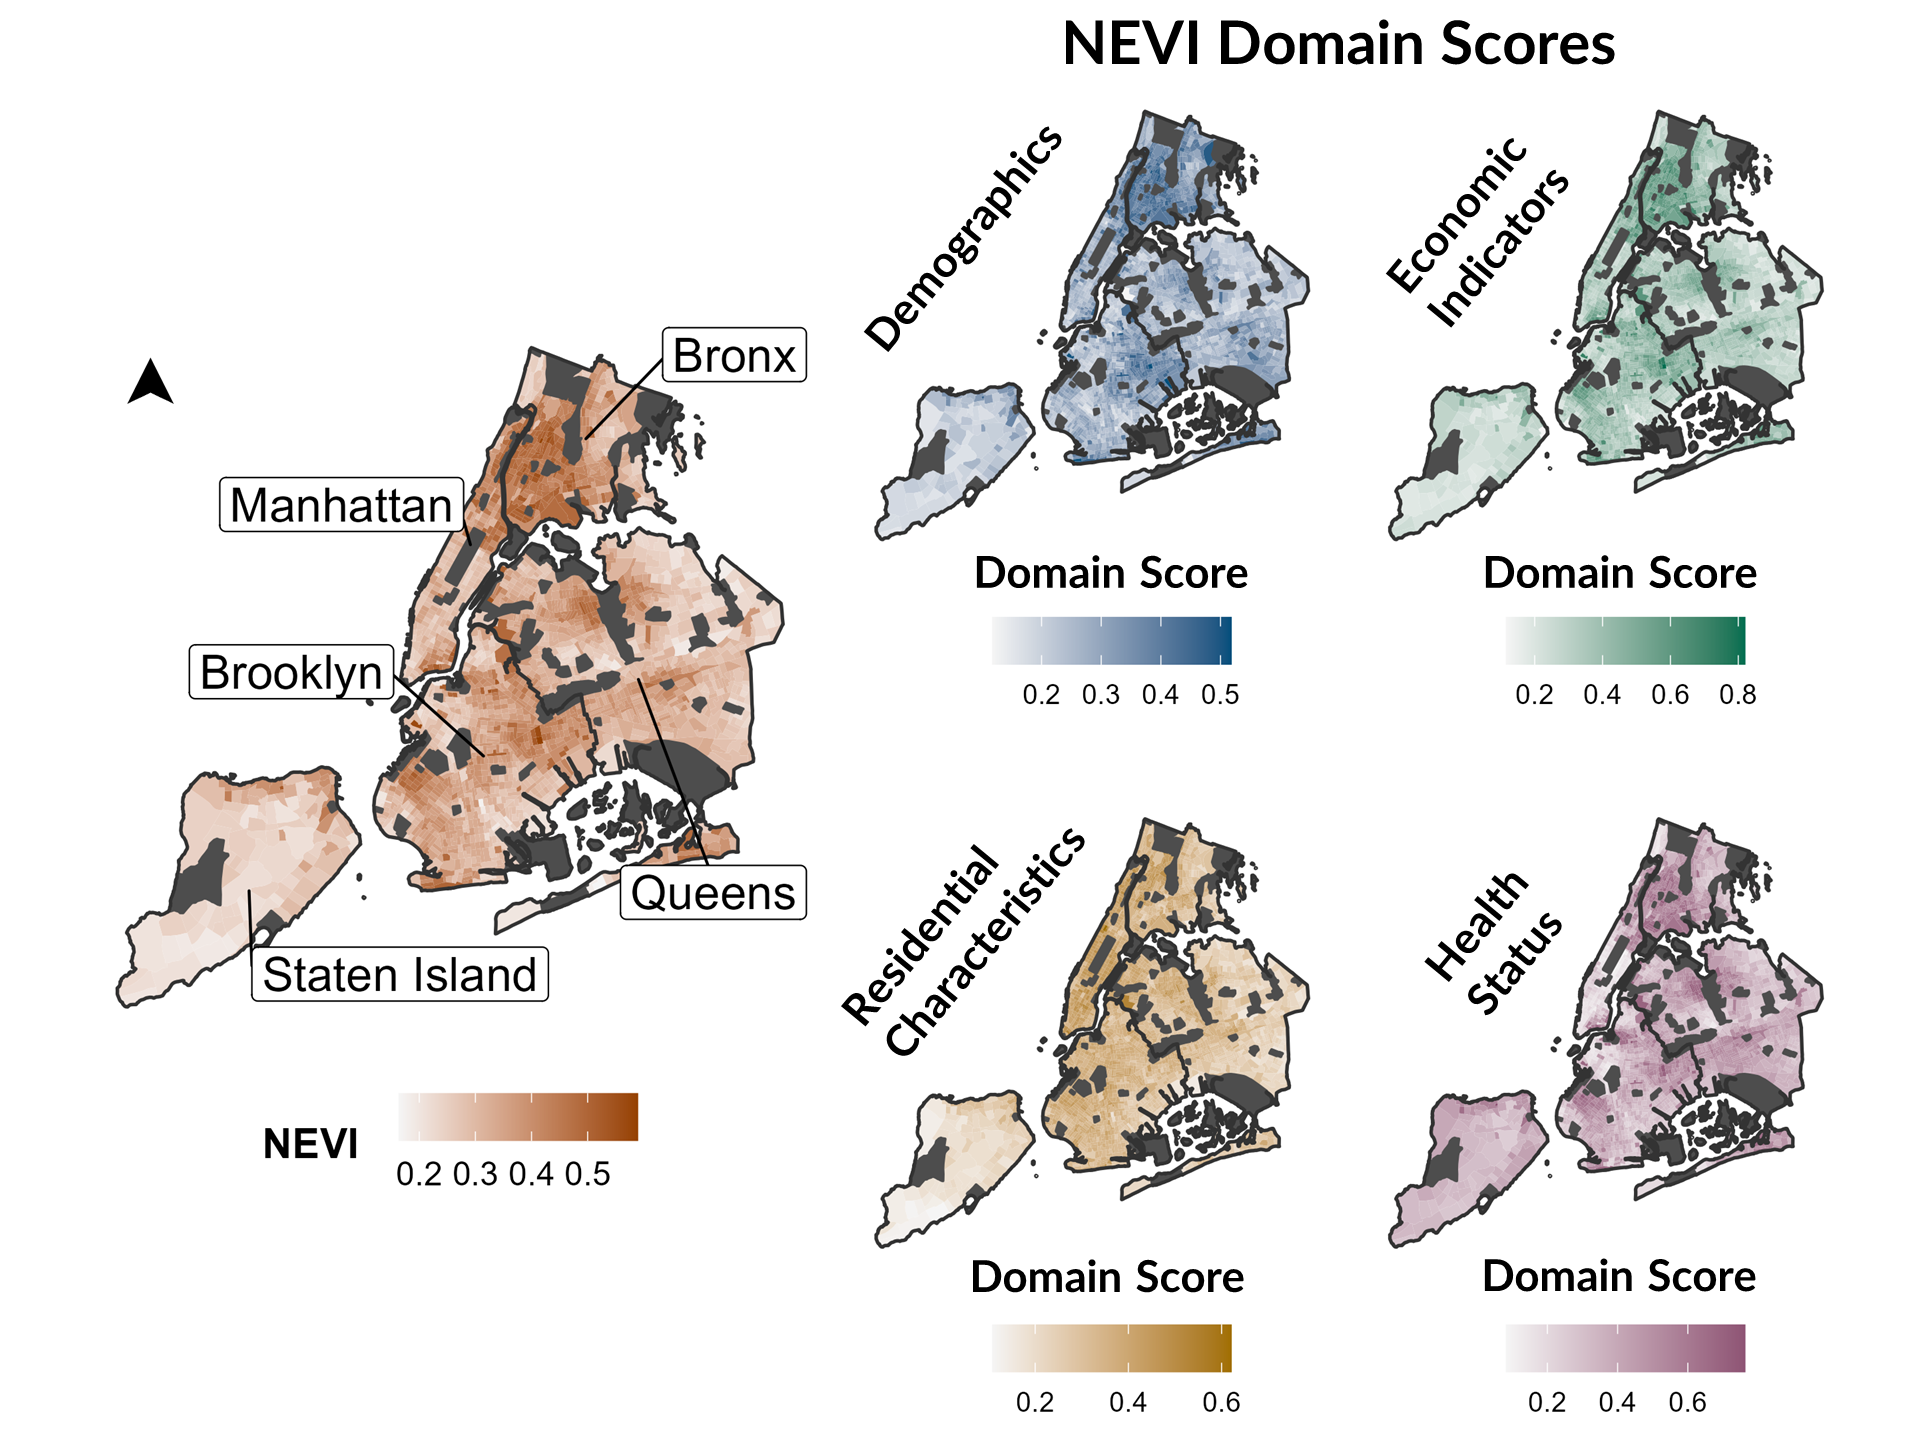
We developed a Neighborhood Environmental Vulnerability Index (NEVI) to measure vulnerability to environmental pollution using publicly available data. We applied the Toxicological Prioritization Index (ToxPi) to integrate data across different domains, characterize neighborhood vulnerability to environmental pollution in New York City (NYC), and determine if sources of vulnerability varied across neighborhoods.
The current version of the NEVI for NYC can be downloaded in the data/processed folder. The data file is available in multiple formats at the following spatial scales:
Census tract-level
- CSV:
nevi_tract_final.csv - R Data file:
nevi_tract_final.rds
Zip code-level
- CSV:
nevi_zip_final.csv - R Data file:
nevi_zip_final.rds
We have organized relevant files for the calculation of the NEVI in the following folders:
code and instructions: Code for the calculation of the indexdata:data/raw: data files downloaded before any data cleaning/processingdata/processed: data files after any data cleaning/processing or created manually
figures and tables: figures and tables created from our code
We used two primary data sources for the following features used to calculate the NEVI:
- U.S. American Community Survey, 2015-2019 5-year estimates: demographics, economic indicators, and residential characteristics
- Request a U.S. Census API key here
- U.S. Centers for Disease Control and Prevention PLACES, 2020: health status information (health behaviors, conditions, preventive practices, and insurance access)
Other data sources used to create zip code-level NEVI:
- Modified Zip Code Tabulation Areas (MODZCTA) used by the New York City Department of Health & Mental Hygiene (NYC DOHMH)
- U.S. Department of Housing and Urban Development - Zip Code and Tract Crosswalk
You will need the following software, R packages, and data to calculate the NEVI.
- Download the following software:
- R
- RStudio or another R graphical user interface
- ToxPi Graphical User Interface
- Run the following code in R to install the following packages:
- These required packages are needed for the creation of the NEVI.
install.packages(c('tidyverse','tidycensus','rio'), dependencies = TRUE) - These optional packages are needed for the creation of clusters and figures and tables presented in the manuscript.
 install.packages(c('factoextra','cluster','skimr','janitor','factoextra','sf','ggpubr','ggsn','ggspatial','tigris','ggsflabel','ggpubr','colorBlindness','ggpattern','gplots'), dependencies = TRUE)
 devtools::install_github('yutannihilation/ggsflabel')
- We used the following versions of software and packages:
- Software:
- R: 4.1.1 ("Kick Things")
- RStudio: 2021.09.0+382 ("Ghost Orchid")
- ToxPi GUI: version 2.3, August 2019 update
- Packages:
tidyverse: 1.3.1tidycensus: 1.1.2rio: 0.5.29
- Optional Packages
cluster: 2.1.2factoextra: 1.0.7skimr: 2.1.3janitor: 2.1.0sf: 1.0.3ggpubr: 0.4.0ggsn: 0.5.0ggspatial: 1.1.5nycgeo: 0.1.0.9000tigris: 1.5devtools: 2.4.3ggsflabel: 0.0.1ggpubr: 0.4.0colorBlindness: 0.1.9ggpattern: 0.2.0gplots: 3.1.1
- U.S. Centers for Disease Control and Prevention PLACES 2020
- Download here.
- U.S. American Community Survey, 5-year estimates from 2015-2019
- To download the data, refer to our code:
code and instructions/A1-download-census-data.Rmd - More information about the American Community 5-year estimates here.
- To download the data, refer to our code:
To calculate the NEVI, you will need to follow the instructions in these documents in the code and instructions folder. Click on the corresponding markdown (.md) files to view the code and instructions directly online.
A1-download-census-data: Download features from the U.S. Census American Community Survey needed to calculate the indexA2-preprocess-nevi-features: Prepare features to input into ToxPi.A3-calculate-nevi-toxpi-gui: Calculate the NEVI and subdomain scores using Toxpi.A4-clean-nevi: Clean the output from ToxPi and calculate domain scores.
There are also other code available to accomplish optional tasks:
B1-create-nevi-clusters: Create clusters based on NEVI subdomain scores and their corresponding weights using hierarchical clusteringB2-calculate-ndi-svi: Calculate a previously created index called the Neighborhood Deprivation Index (NDI).B3-create-figures-tables: Create figures and tables presented in the manuscript.B4-calculate-nevi-zip: Calculate zip code-level NEVI from Census tract-level NEVI using residential ratios.
Below are steps to clone this repository to your local device with RStudio. Please refer to this link for more information about using git in RStudio.
- On top this page, click on
Codeand copy the link to this git repository (starts with https://github.com/...). - Open RStudio.
- In RStudio, click on
File→New Project...→Version Control→Git. - Under "Repository URL", paste the link of the git repository.
- Under "Project directory name", name your project directory.
- Under "Create project as subdirectory of:", select the folder in which you would like your project directory to be located.
- Click on
Create Projectwhen you are done to clone your repository! This should take a minute or two to complete.
The creation of this index was conducted under contract to the Health Effects Institute (HEI), an organization jointly funded by the United States Environmental Protection Agency (EPA) (Assistance Award No. CR-83998101) and certain motor vehicle and engine manufacturers (#4985-RFA20-1B/21-8). The contents of this repository do not necessarily reflect the views of HEI, or its sponsors, nor do they necessarily reflect the views and policies of the EPA or motor vehicle and engine manufacturers. Additional funding was received from the Robert Wood Johnson Foundation (Amos Medical Faculty Development Award) and National Institutes of Health National Institute of Environmental Health Sciences (T32ES007322, R00ES027022, P30ES023515, and R01ES030717), National Institute of Diabetes and Digestive and Kidney Diseases (P30DK111022), and National Heart, Lung, and Blood Institute (K01HL140216).
