This project includes Exploratory Data Analysis and Data Visualization on Power Supply and Demand data across the states of India over a period of 2014 -2018 using TABLEAU.
Data was downloaded form Open Government Data Portal.
(Including only a few insights, other insights included in the Code File. )
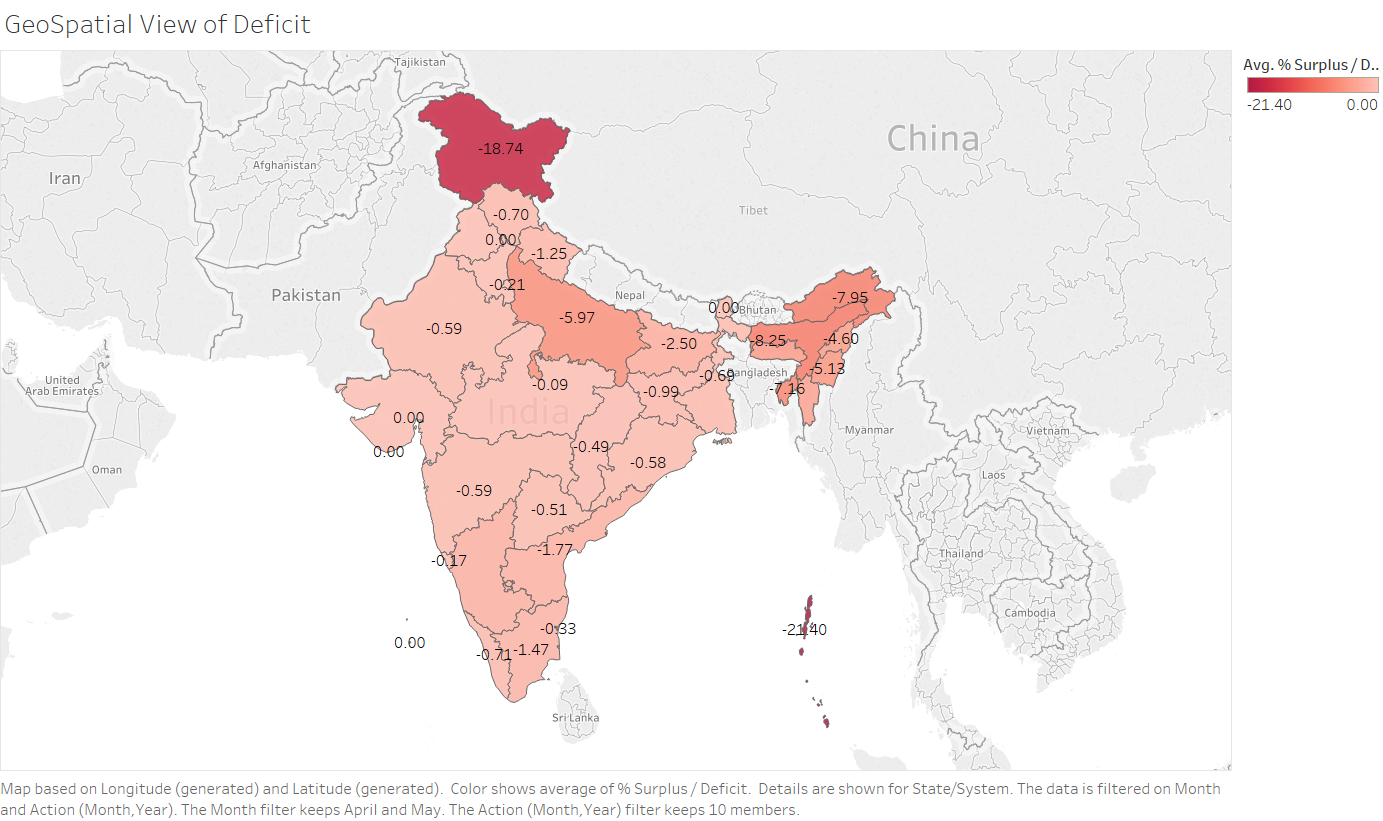
- Geographical Symbol Maping of Surplus/Deficit in Percent.
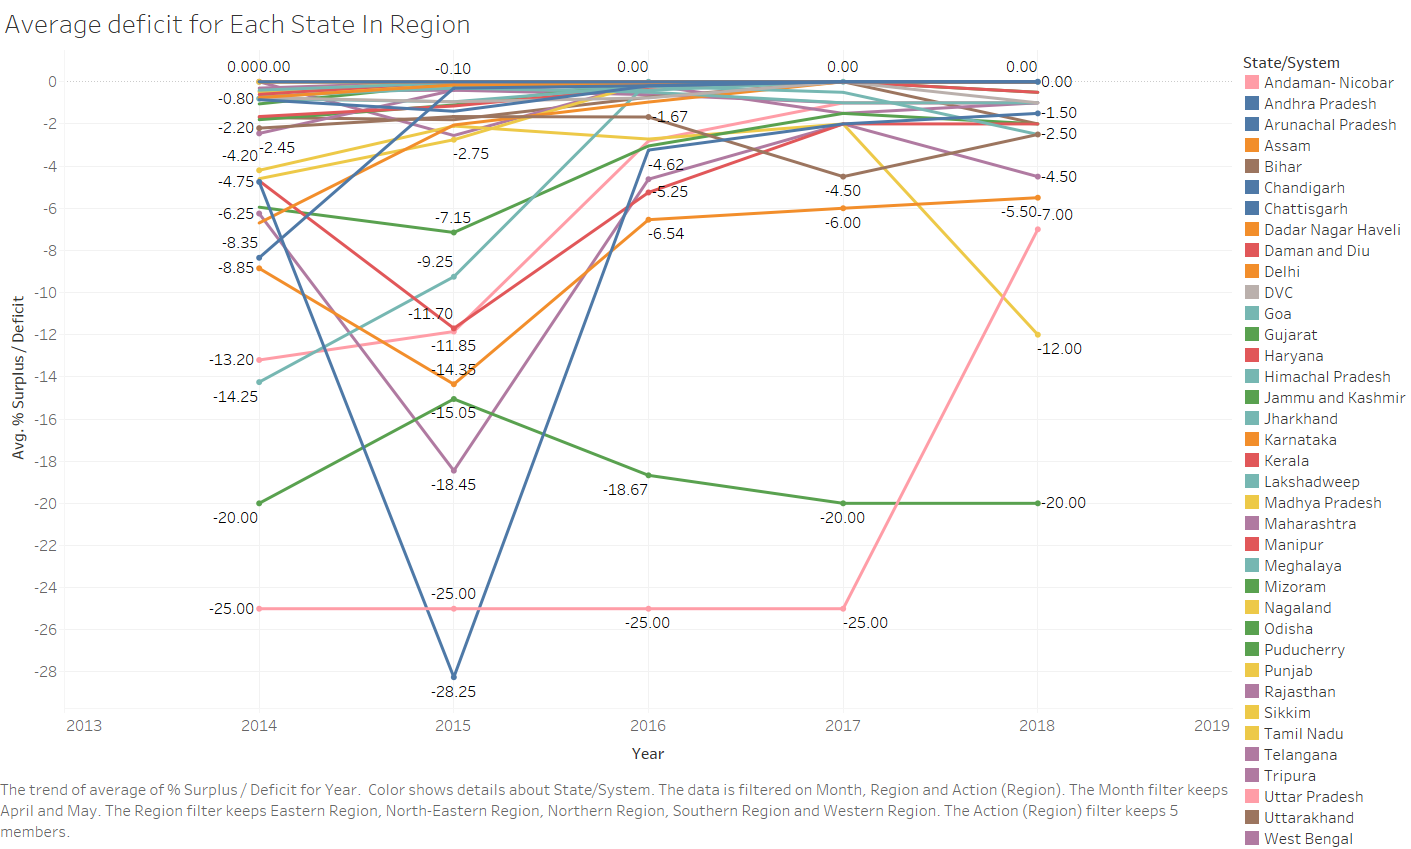
- Line Plot of Average Surplus/Deficit in Percent.
- Horizontal Bar Graph of Requirements as per State every year.


