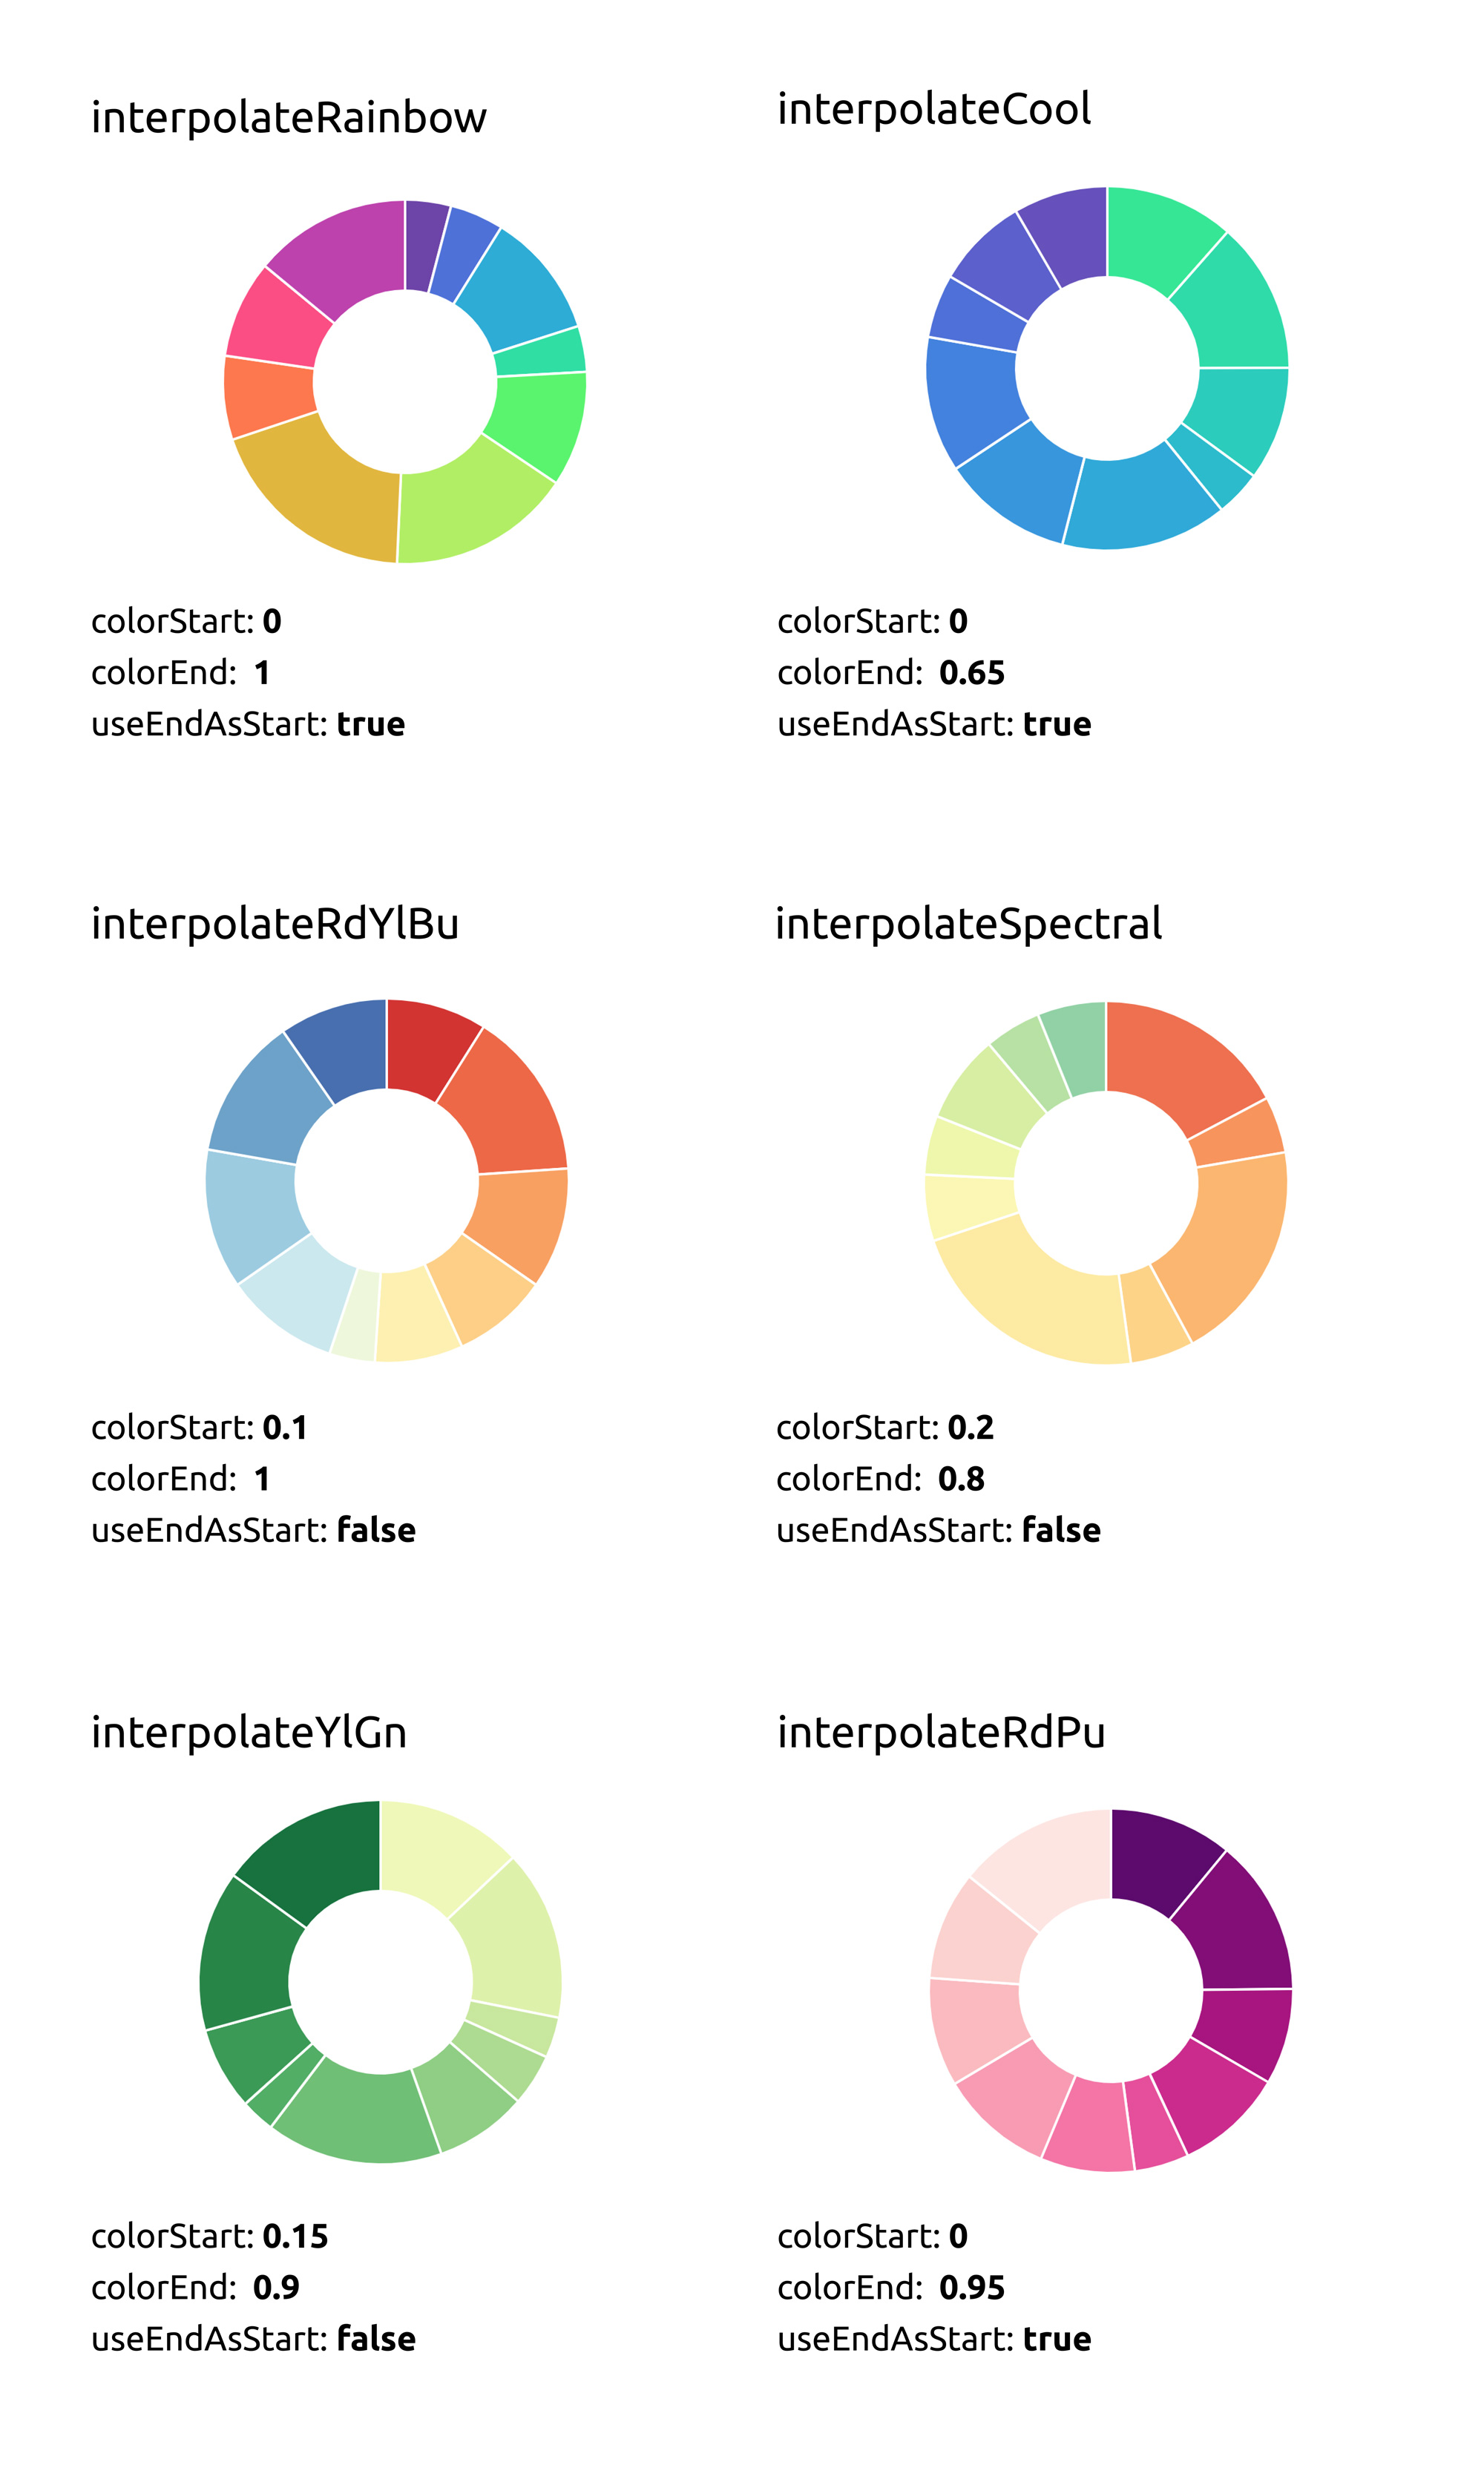
This repository shows you how to automatically generate chart colors with Chart.js and D3 Scale Chromatic. We specifically use D3 Scale Chromatic's interpolate color functions.
We've written a detailed tutorial that walks you through the color generating functions and chart creation. Read it on the 🌟 CodeNebula blog: Automatically Generate Chart Colors with Chart.js & D3's Color Scales.
- (Optional) Open
index.htmlin your code editor - (Optional) Feel free to change the "Example Data" parameters listed on lines 76 - 101 (change line 95 if you'd like to test another D3 interpolate color scale)
- Navigate to your browser and open
index.htmlto see the generated chart
