Data Analytics Repo: Dive into the world of insights with our collection of projects! Uncover patterns, trends, and make data-driven decisions.
-
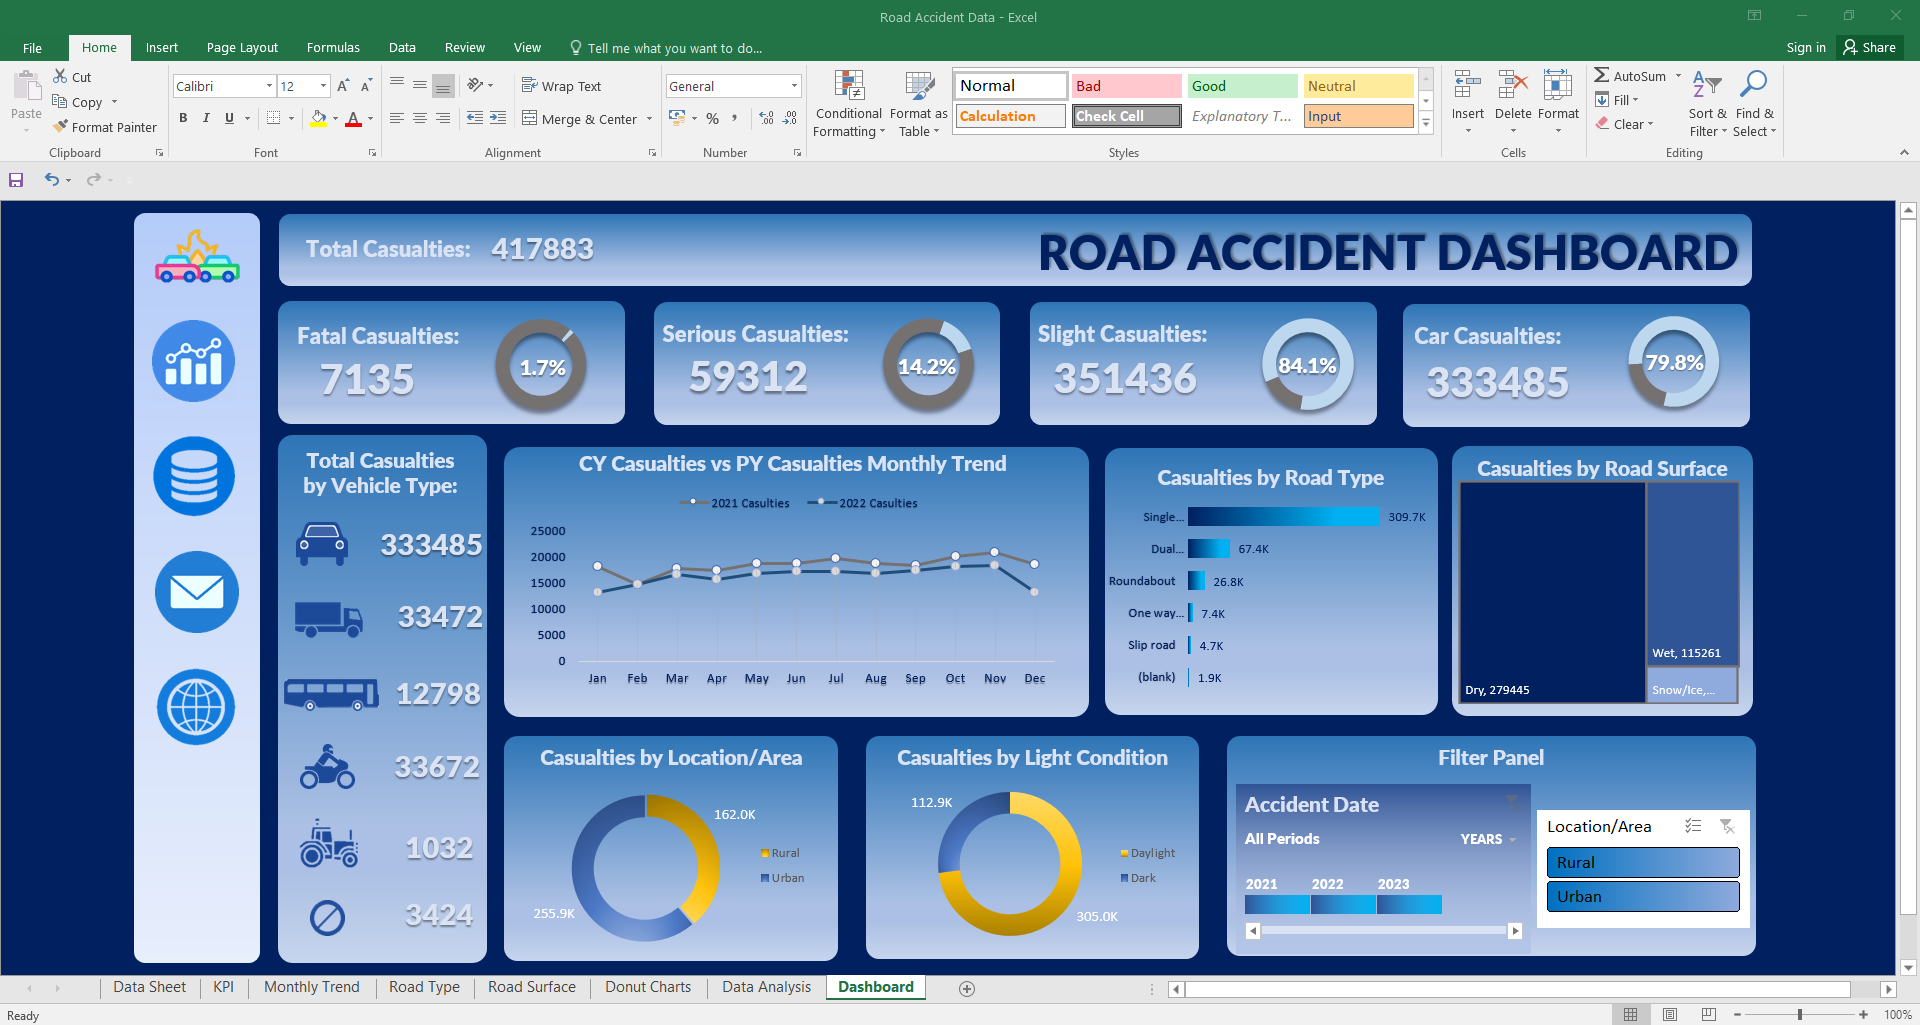
 This data analysis project aims to create an Excel dashboard using the "Road Accident Dataset" sourced from Kaggle. The project involves five main steps: Data Cleaning, Data Processing, Data Analysis, Data Visualization, and creating the final
Dashboard. The objective is to provide insights into road accidents for the years 2021 and 2022, focusing on various key performance indicators (KPIs) and their relationships with different factors.
- CAPM Web Application -
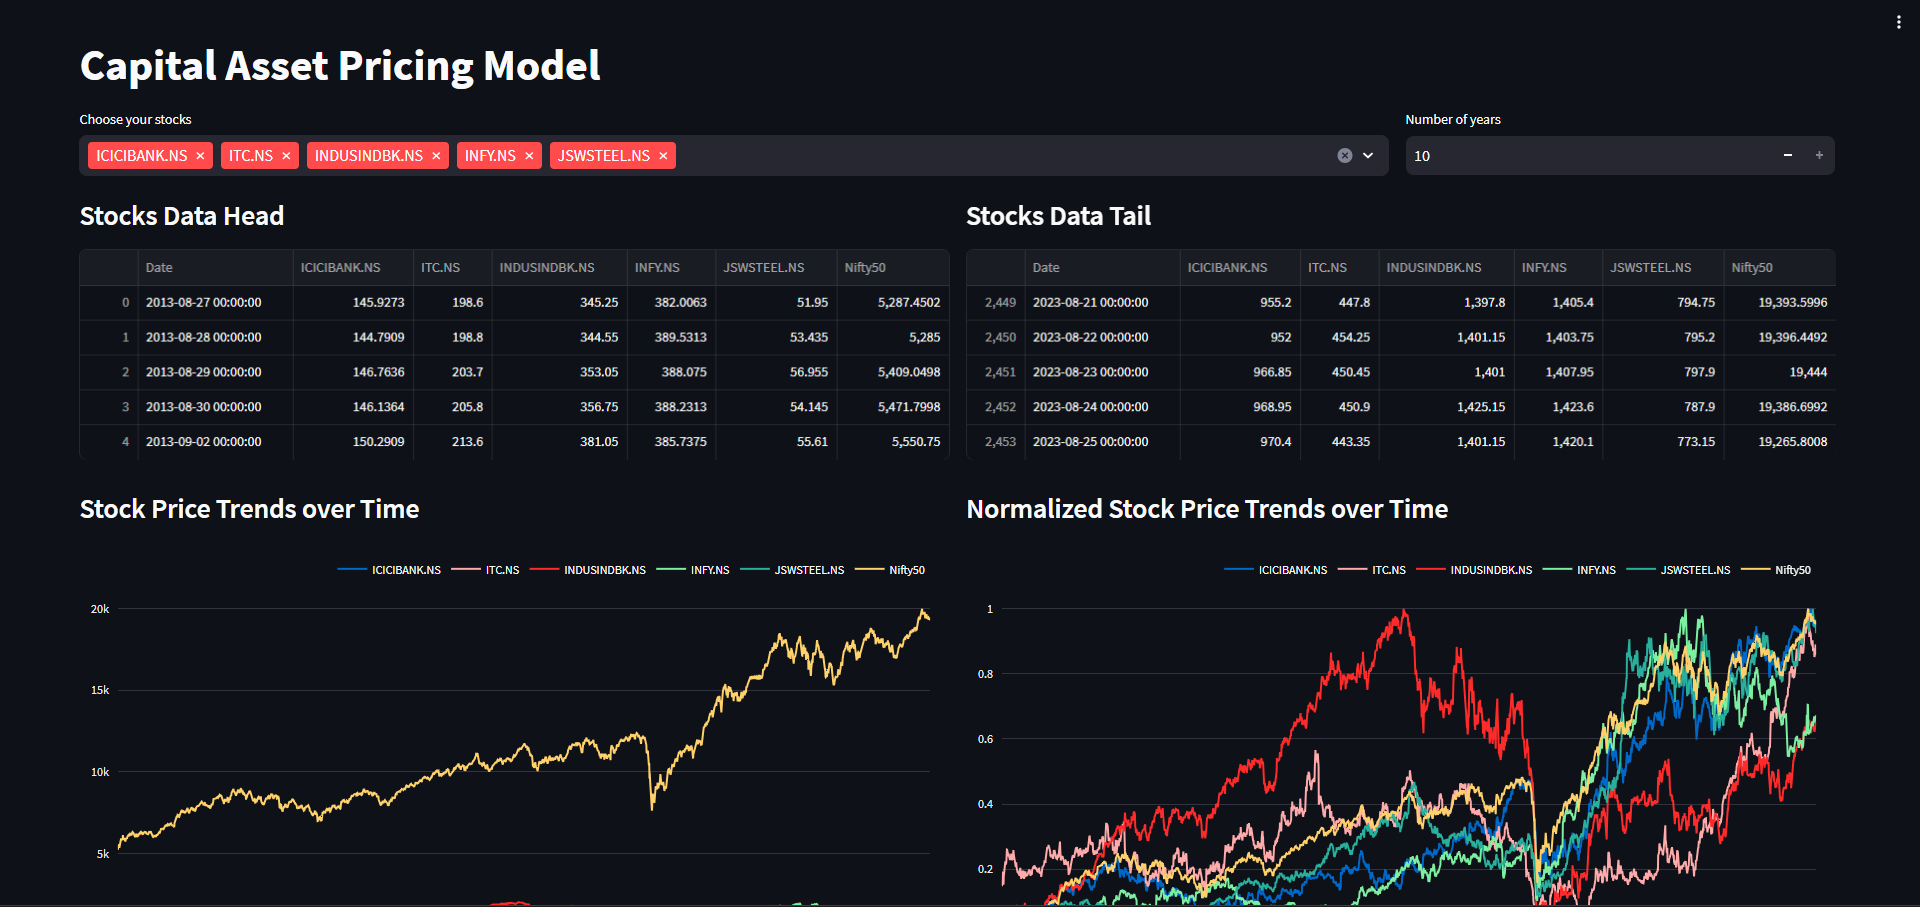
 Created a web application project using Python that utilizes the Capital Asset Pricing Model (CAPM), a fundamental finance formula connecting asset returns to market risk. This application calculates expected returns by considering the risk-
free rate, market risk premium, and stock beta value. By incorporating Streamlit and Yahoo Finance data, this Python-powered app empowers investors to analyze and make well-informed decisions regarding risk, return, and portfolio allocation.
-
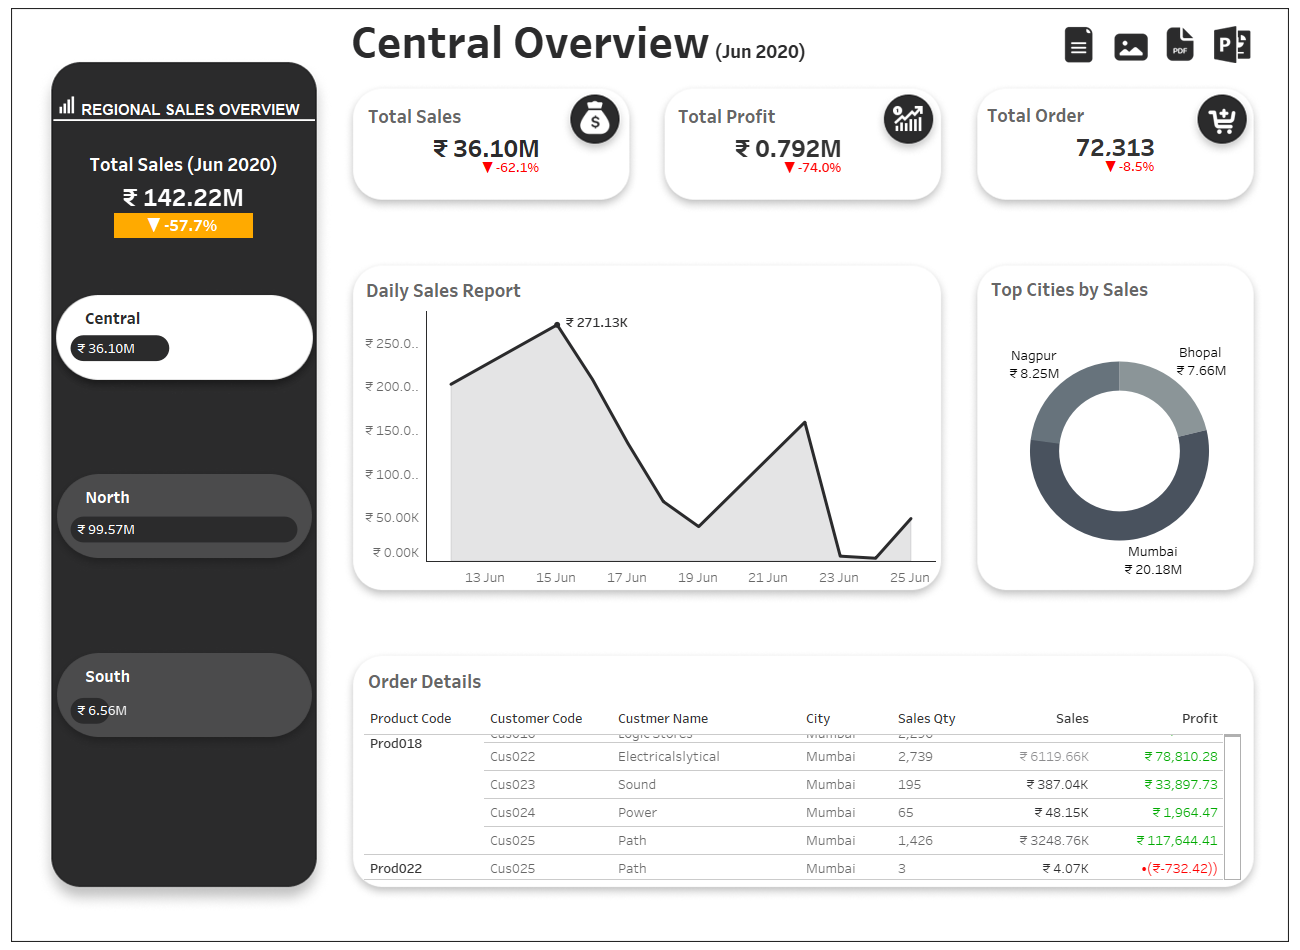
This project aimed to boost sales by leveraging data insights. Through PostgreSQL analysis and Tableau visualization, an automated dashboard created to uncover trends. Success was achieved as the dashboard enabled better decision-making, reduced costs by 10%, and saved 20% of analysts' time. This project exemplified the value of data-driven strategies in navigating challenges and fostering growth.

