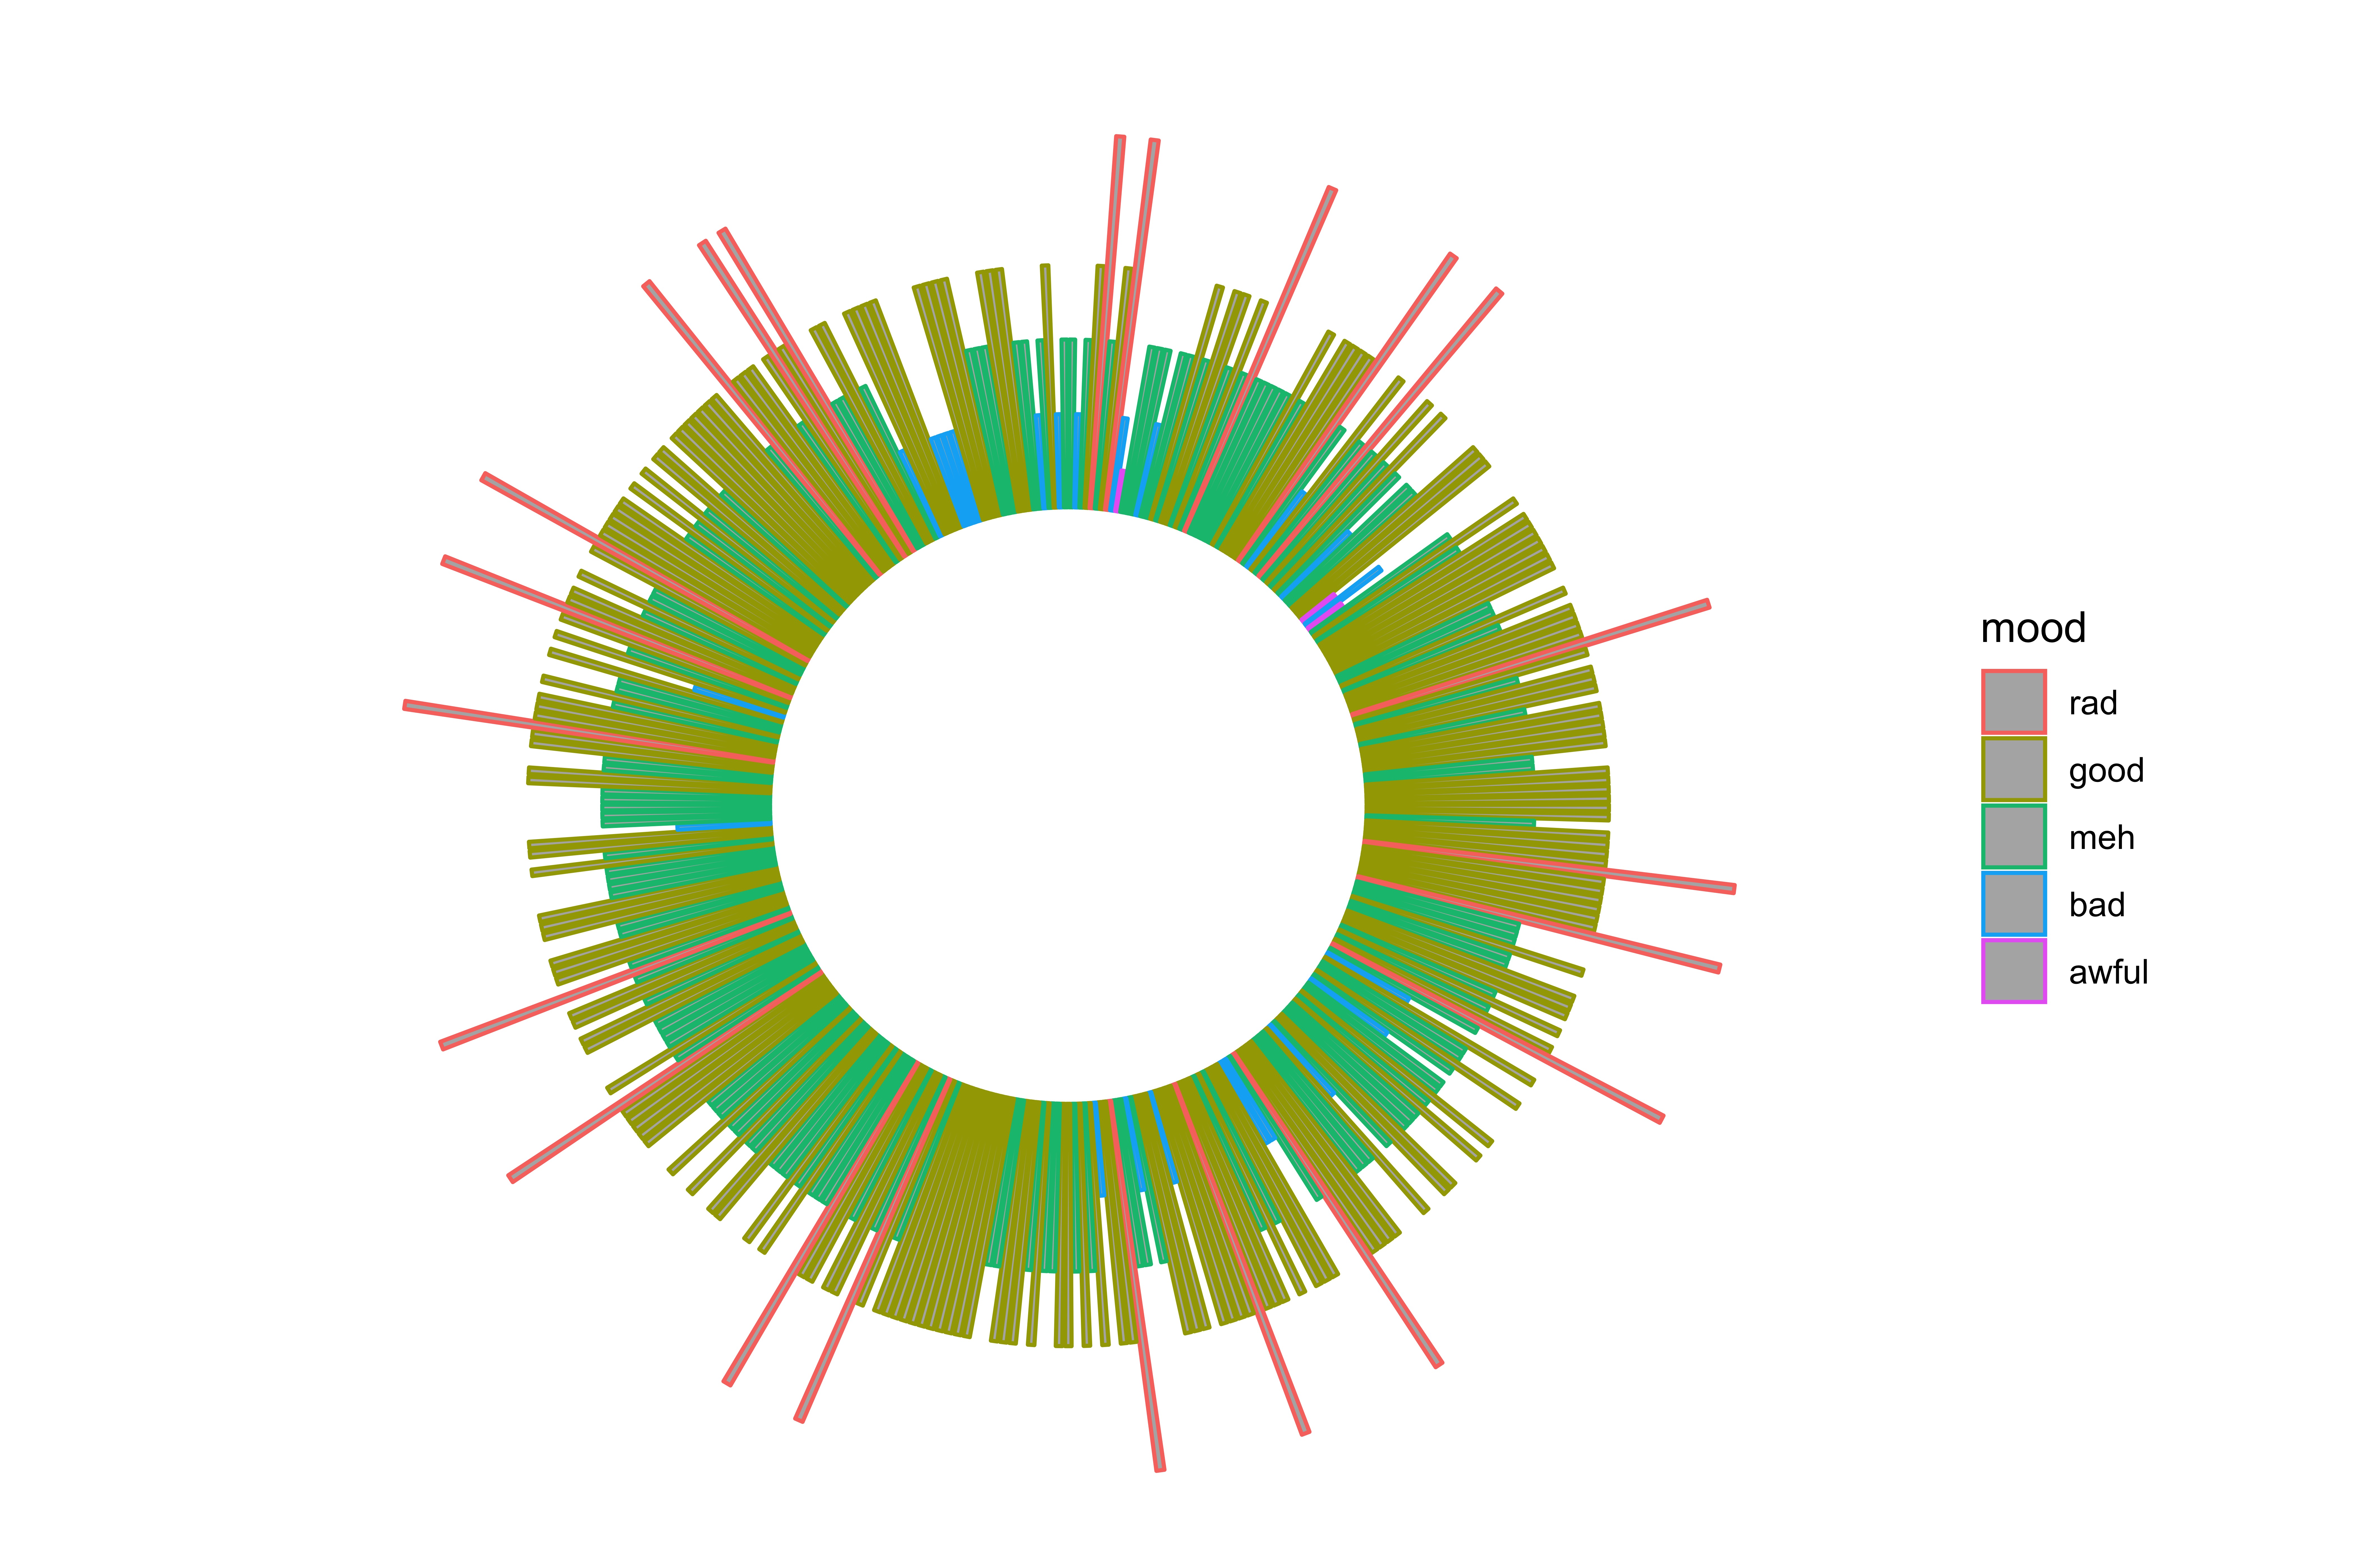
R script to take a CSV file from the mood-tracking app Daylio and create a circular barplot visualization of a full year. Deafult is for 365 days but can be changed.
-
Notifications
You must be signed in to change notification settings - Fork 1
lmccay4/DaylioCircularBarplot
This commit does not belong to any branch on this repository, and may belong to a fork outside of the repository.
Folders and files
| Name | Name | Last commit message | Last commit date | |
|---|---|---|---|---|
Repository files navigation
About
R script to take a CSV file from the mood-tracking app Daylio and create a circular barplot visualization of a full year.
Topics
Resources
Stars
Watchers
Forks
Releases
No releases published
Packages 0
No packages published


