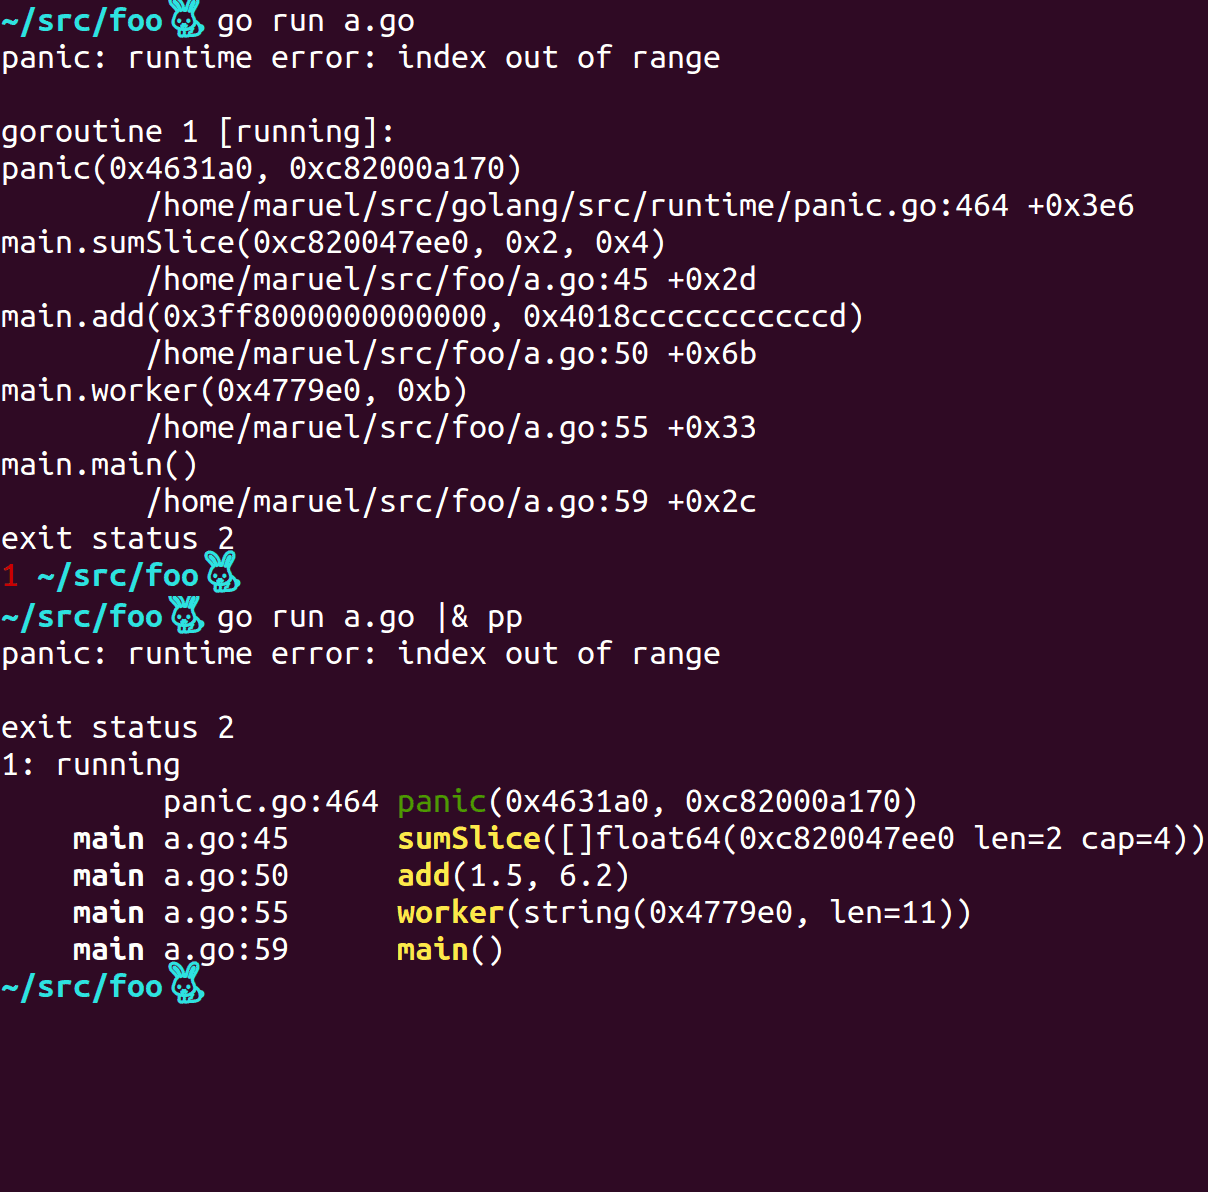
Parses panic stack traces, densifies and deduplicates goroutines with similar stack traces. Helps debugging crashes and deadlocks in heavily parallelized process.
panicparse helps make sense of Go crash dumps:
- Race detector support, e.g. it can parse output produced by
go test -race - HTML export.
- Easy to use as an HTTP Handler middleware.
- High performance parsing.
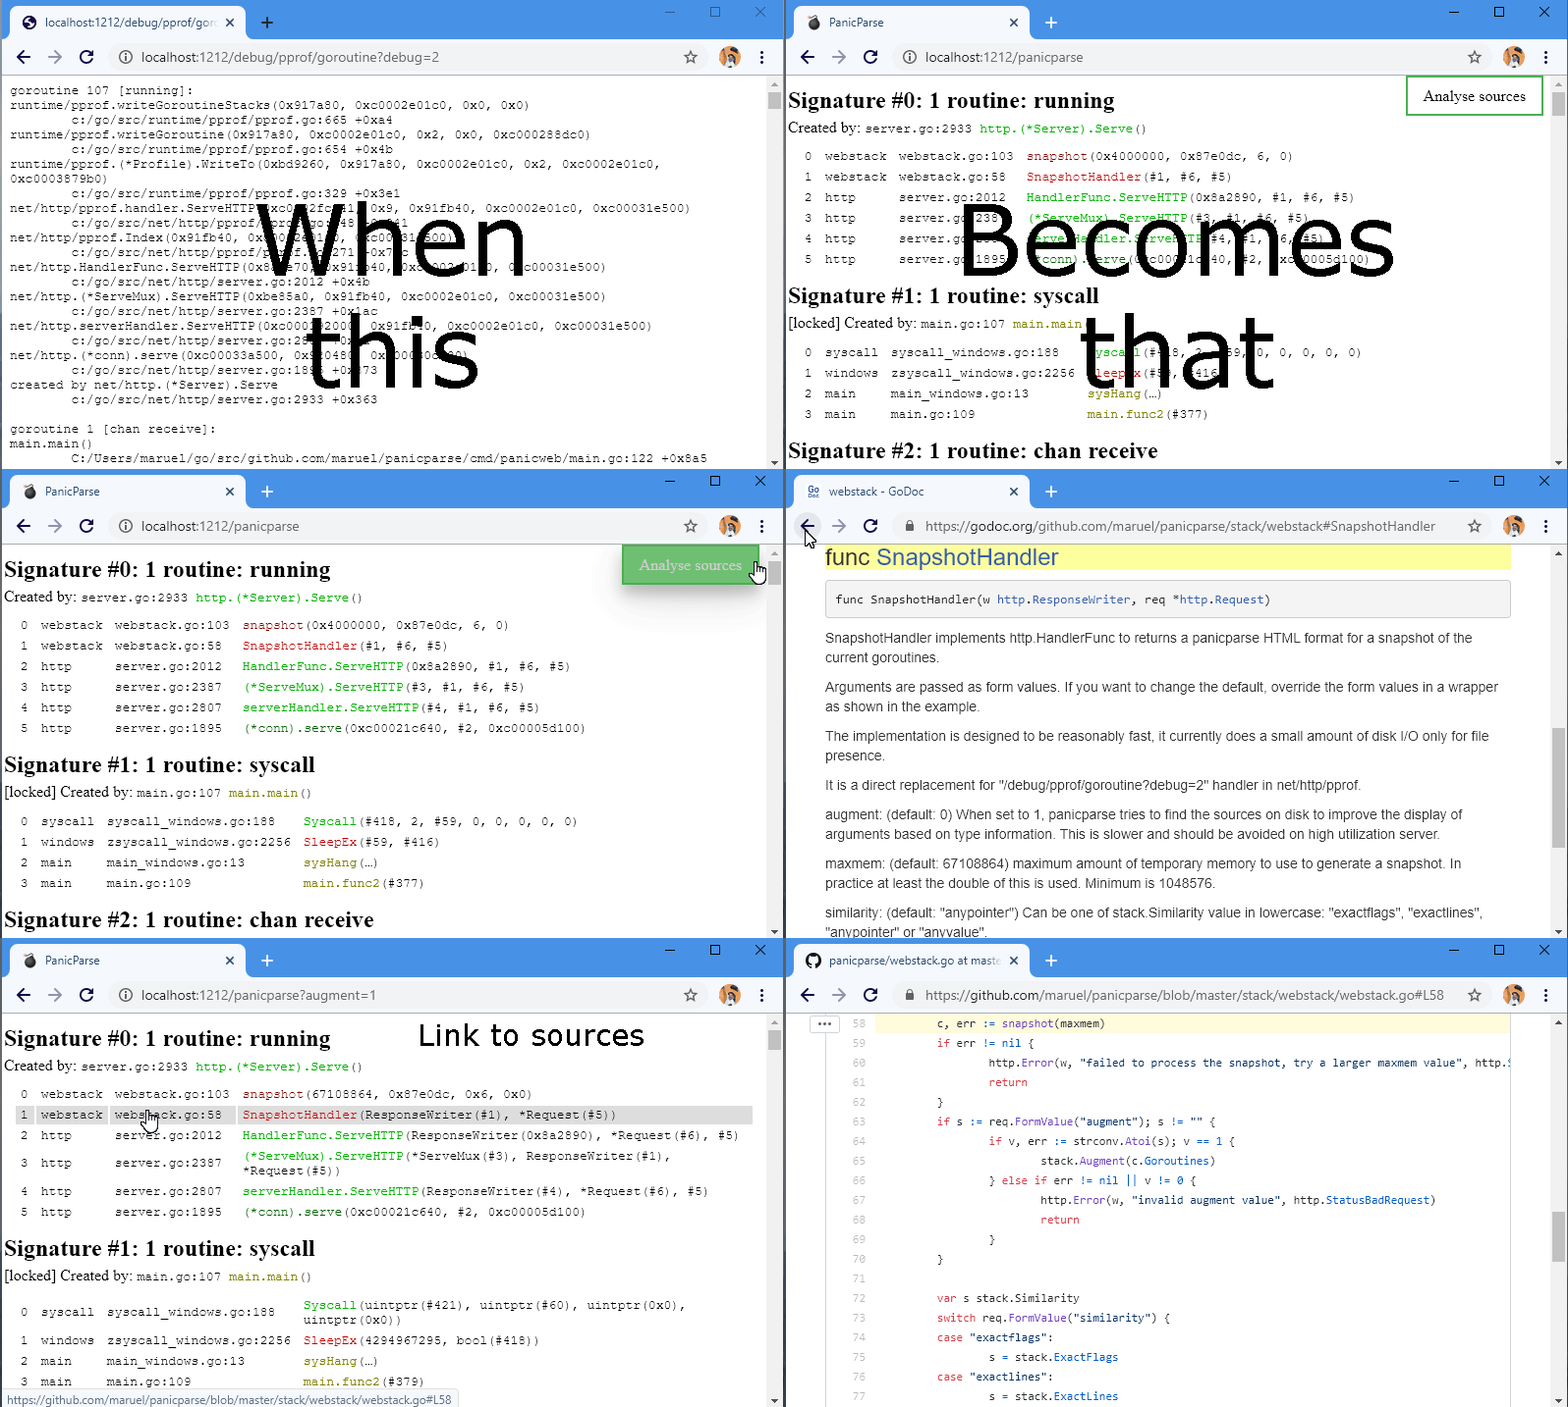
- HTTP web server that serves a very tight and swell snapshot of your goroutines, much more readable than net/http/pprof.
- >50% more compact output than original stack dump yet more readable.
- Deduplicates redundant goroutine stacks. Useful for large server crashes.
- Arguments as pointer IDs instead of raw pointer values.
- Pushes stdlib-only stacks at the bottom to help focus on important code.
- Parses the source files if available to augment the output.
- Works on any platform supported by Go, including Windows, macOS, linux.
- Full go module support.
- Requires >=go1.17. Use v2.3.1 for older Go versions.
go install github.com/maruel/panicparse/v2/cmd/pp@latest
- Ubuntu (bash v4 or zsh):
|& - macOS, install bash 4+, then:
|& - Windows or macOS with stock bash v3:
2>&1 | - Fish shell:
&|
pp streams its stdin to stdout as long as it doesn't detect any panic.
panic() and Go's native deadlock detector print to
stderr via the native print()
function.
Bash v4 or zsh: |& tells the shell to redirect stderr to stdout,
it's an alias for 2>&1 | (bash
v4,
zsh):
go test -v |&pp
Windows or macOS native bash (which is 3.2.57): They don't have this shortcut, so use the long form:
go test -v 2>&1 | pp
Fish: &| redirects stderr and stdout. It's an alias for 2>&1 |
(fish piping):
go test -v &| pp
PowerShell: It has broken 2>&1 redirection. The workaround is to shell out to cmd.exe. :(
On POSIX, use Ctrl-\ to send SIGQUIT to your process, pp will ignore
the signal and will parse the stack trace.
To dump to a file then parse, pass the file path of a stack trace
go test 2> stack.txt
pp stack.txt
The Go toolchain inlines functions when it can. This causes traces to be less informative. Optimization also interfere with traces. You can use the following to help diagnosing issues:
go install -gcflags '-N -l' path/to/foo
foo |& pp
or
go test -gcflags '-N -l' ./... |& pp
Run go tool compile -help to get the full list of valid values for -gcflags.
By default, GOTRACEBACK defaults to
single, which means that a panic will only return the current goroutine trace
alone. To get all goroutines trace and not just the crashing one, set the
environment variable:
export GOTRACEBACK=all
or set GOTRACEBACK=all on Windows. Probably worth to put it in your .bashrc.
Install bash v4+ on macOS via homebrew or macports. Your future self will appreciate having done that.
If you try pp for the first time and you get:
Creating tables and indexes...
Done.
and/or
/usr/bin/pp5.18: No input files specified
you may be running the Perl PAR Packager instead of panicparse.
You have two choices, either you put $GOPATH/bin at the beginning of $PATH
or use long name panicparse with:
go install github.com/maruel/panicparse/v2@latest
then using panicparse instead of pp:
go test 2> panicparse
Hint: You may also use shell aliases
alias gp=panicparse
go test 2> gp

alias p=panicparse
go test 2> p
The webstack.SnapshotHandler http.Handler enables glancing at at a snapshot of your process trivially:
panicparse was created with ❤️️ and passion by Marc-Antoine
Ruel and
friends.

