The objective of this homework was to process the DBLP dataset using Hadoop Map-Reduce framework to find out the number of publications made by faculty in the Department of Computer Science at the University of Illinois at Chicago, and to generate a graph to visualize this output.
The results obtained after running the map reduce job were visualized using Graphviz:

Each node is labelled with the faculty name and their total number of publications. The size and color of the nodes is relative to the log of number of publications. Logarithmic scale was chosen so that the node size of faculty with large number of publications is not too big in comparison to that of faculty with small number of publications. The log of maximum number of publications by any faculty is divided into 10 buckets to assign the colors using set310 color scheme from the Brewer color schemes.
Each edge in the graph is labelled with the number of publications that were co-authored by the faculty connected by those edges. The thickness of the edges is relative to the number of publications denoted by the edge.
The project was developed using the following environment:
- OS: Windows 10
- IDE: IntelliJ IDEA Ultimate 2018.3
- Hypervisor: VMware Workstation 15 Pro
- Hadoop Distribution: Hortonworks Data Platform (3.0.1) Sandbox deployed on VMware
- HDP Sandbox set up and deployed on (VMware or VirtualBox). Read this guide for instructions on how to set up and use HDP Sandbox
- Ability to use SSH and SCP on your system
- SBT installed on your system
- dblp.xml downloaded on your system
-
Clone or download this repository onto your system
-
Open the Command Prompt (if using Windows) or the Terminal (if using Linux/Mac) and browse to the project directory
-
Build the project and generate the jar file using SBT
sbt clean compile assembly -
Start HDP sandbox VM
-
Copy the jar file to HDP Sandbox VM
scp -P 2222 target/scala-2.12/mayank_k_rastogi_hw2-assembly-0.1.jar root@sandbox-hdp.hortonworks.com:~/ -
Copy
dblp.xmlto HDP Sandboxscp -P 2222 /path/to/dblp.xml root@sandbox-hdp.hortonworks.com:~/ -
SSH into HDP Sandbox
ssh -p 2222 root@sandbox-hdp.hortonworks.com -
Create input directory on HDFS and copy
dblp.xmltherehdfs dfs -mkdir input_dir hdfs dfs -put dblp.xml input_dir/ -
Start the map-reduce job
hadoop jar mayank_k_rastogi_hw2-assembly-0.1.jar input_dir output_dir -
You may check the logs using the YARN and grep. The application ID will get printed when the map-reduce job is run
yarn logs -applicationId application_<your-application-id> | grep FacultyCollaboration
-
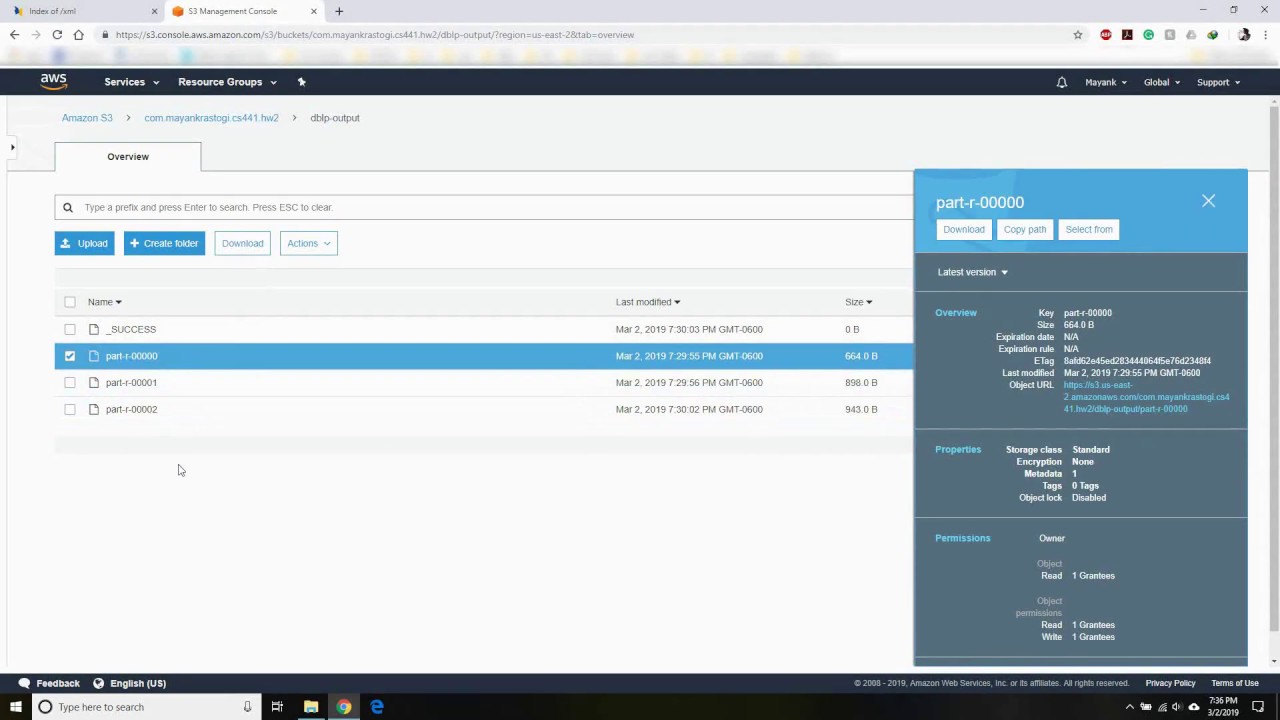
Once the map-reduce job is finished, copy the output files from
output_dir(on HDFS) tomap_reduce_output(on HDP Sandbox)hdfs dfs -get output_dir map_reduce_output -
Logout from your SSH session on HDP Sandbox
exit -
Copy the
map_reduce_outputdirectory to your local systemscp -P 2222 -r root@sandbox-hdp.hortonworks.com:~/map_reduce_output ./ -
Run the
GraphGeneratorto readmap_reduce_outputand generatefaculty_collaborations.dotfilesbt "runMain com.mayankrastogi.cs441.hw2.graph.GraphGenerator map_reduce_output"
Viz.js is an online tool that uses Graphviz to generate graphs from .dot files. Although, we can use the Graphviz directly on our system, I could not manage to get the desired output from the command-line version of the program. It seemed to ignore parameters such as splines=true and sep=3, resulting in a lot of overlapping of node names in the generated image.
Follow the below instructions to generate an image from the faculty_collaborations.dot file:
- Open
faculty_collaborations.dotfile in a text editor - Copy all the contents of this file
- Open Viz.js in your web browser
- Paste the contents of
faculty_collaborations.dotin the left pane on the website - Choose
neatoas the engine and the desired output format (say, .png)
To see a demo of how this project can be deployed on AWS Elastic Map Reduce (EMR), see this video on YouTube
The dblp.xml file has <dblp> as the root element. Under <dblp>, we can have <article>, <inproceedings>, <proceedings>, <book>, <incollection>, <phdthesis>, <mastersthesis> or <www>. Since <www> holds information about an author and not a publication itself, we are ignoring this tag in our program.
Except <book> and <proceedings>, each of these tags contain one or more <author> tags which denote an author for that publication. The <book> and <proceedings> tags have a similar tag <editor>. We treat both these tags as the same, which means that the presence of a faculty's name in either of these tags will count towards their total number of publications and collaborations.
The MultiTagXmlInputFormat takes care of sharding the dblp.xml file into logical subsets that are fed into the FacultyCollaborationMapper. It reads the dblp.xml file and looks for one of these start tags – <article , <inproceedings , <proceedings , <book , <incollection , <phdthesis , <mastersthesis . Once a match is found, it stores all the bytes that appear after the matched start tag, into a buffer, until the corresponding end tag is found. This forms our logical split that is then fed into a mapper. The start and end tags to look for can be configured using faculty-collaboration.xml-input.start-tags and faculty-collaboration.xml-input.end-tags configuration settings in application.conf.
The FacultyCollaborationMapper takes in a subset of dblp.xml file and parses it using Scala's scala-xml module. The mapper then extracts all the entries within <author> or <editor> tags and matches them against the list of faculty that belong to UIC's CS department, which is defined in src/main/resources/uic-cs-faculty-list.txt. This file maps the different variations of a faculty's name (that are known to appear in the dblp.xml file) to the faculty's name as it appears on the UIC CS Department Website.
The list of faculty found associated with a publication is then sorted in lexicographical order and all combinations of pairs of faculty (nC2 + nC1) are generated from this list, and then joined with --. For example, if the list of authors extracted from the subset is List("Philip S. Yu", "Ouri Wolfson", "Peter Nelson"), then the following combinations will be generated:
Iterator(
    "Ouri Wolfson",
    "Peter Nelson",
    "Philip S. Yu",
    "Ouri Wolfson -- Peter Nelson",
    "Ouri Wolfson -- Philip S. Yu",
    "Peter Nelson -- Philip S. Yu"
)
The sorting step ensures that there is only one way of forming a string that represents the same combination of two faculty.
The mapper then emits these combinations as keys with a value of 1, where each key having one faculty name represents a node and each key having a pair of faculty names represent an edge, such that the text file written to the disk with the results of a mapper will look like this:
Ouri Wolfson	1
Peter Nelson	1
Philip S. Yu	1
Ouri Wolfson -- Peter Nelson	1
Ouri Wolfson -- Philip S. Yu	1
Peter Nelson -- Philip S. Yu	1
The job of FacultyCollaborationReducer is very simple. It simply adds up all the values of the same key to get the final count of number of publications by each individual faculty and each faculty pair. The output from the reducer is in the same format as that of the mapper.
The GraphGenerator reads the output files generated by the map-reduce job and generates a .dot file that can in turn be used to generate a graph using Graphviz.
Since the output from the map-reduce job may consist of multiple part files, the program first concatenates all the files present in the specified input directory, except _SUCCESS. It then splits all the lines by new-line characters (\n, \r). Each line is then split by the tab character (\t) to get the keys and values. Separate lists of nodes and edges is then created depending on whether the keys contain -- or not.
The log of maximum number of publications by any faculty is divided into 10 buckets to assign the colors using set310 color scheme from the Brewer color schemes. The size of each node is determined by log(number of publications) / log(maximum number of publications by any faculty). Similarly, the thickness of the edges is determined by (number of publications co-authored by the faculty pair) / (maximum number of publications co-authored by any faculty pair).
The above information is used to write the output in .dot format.