Requirements:
Docker or Podman * tested with Docker 19.03.8 and Podman 1.8.1.
Get the data from public API. Get your Kaggle.com credentials from: https://www.kaggle.com/docs/api#getting-started-installation-&-authentication and add them to kaggle.json file.
Steps:
-
Clone and cd into this repo: git clone https://github.com/progamandoconro/coronaCOVID19 && cd coronaCOVID19/RSTUDIO
-
Add your credentials to
kaggle.jsonand build with docker or podman
Docker: docker build . -t corona/rstudio
Podman: podman build . -t corona/rstudio
- Run the server and go to
localhost:8787in the browser.
Docker: docker run -dit --env PASSWORD=coronavirus --restart always -p 8787:8787 corona/rstudio
Podman: podman run -dit --ulimit="nofile=4096" --env PASSWORD=coronavirus -p 8787:8787 corona/rstudio
name: rstudio
password: coronavirus
-
Server includes
git,ssh,pipandkaggle, as well as pre-installed R packages:dplyr,ggplot2,shiny,reticulateand more. -
You can always install more R packages with
install.packages('')or Python's usingpip install.
Steps: Same as before but inside RSTUDIO+SHINY directory.
With daily pdf reports from https://www.mscbs.gob.es/
Steps: Same as before but inside FULL+DATA+SPAIN directory.
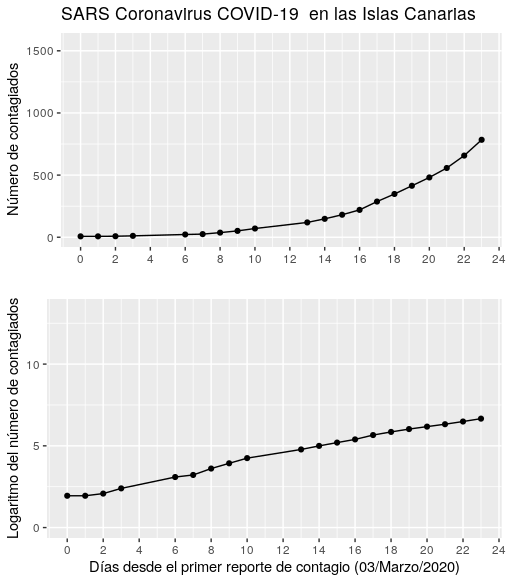
Data scraping and mining to obtain time series of COVID cases in Canarian islands.
Example plot:

