This repository has been archived by the owner on Aug 12, 2021. It is now read-only.
Home
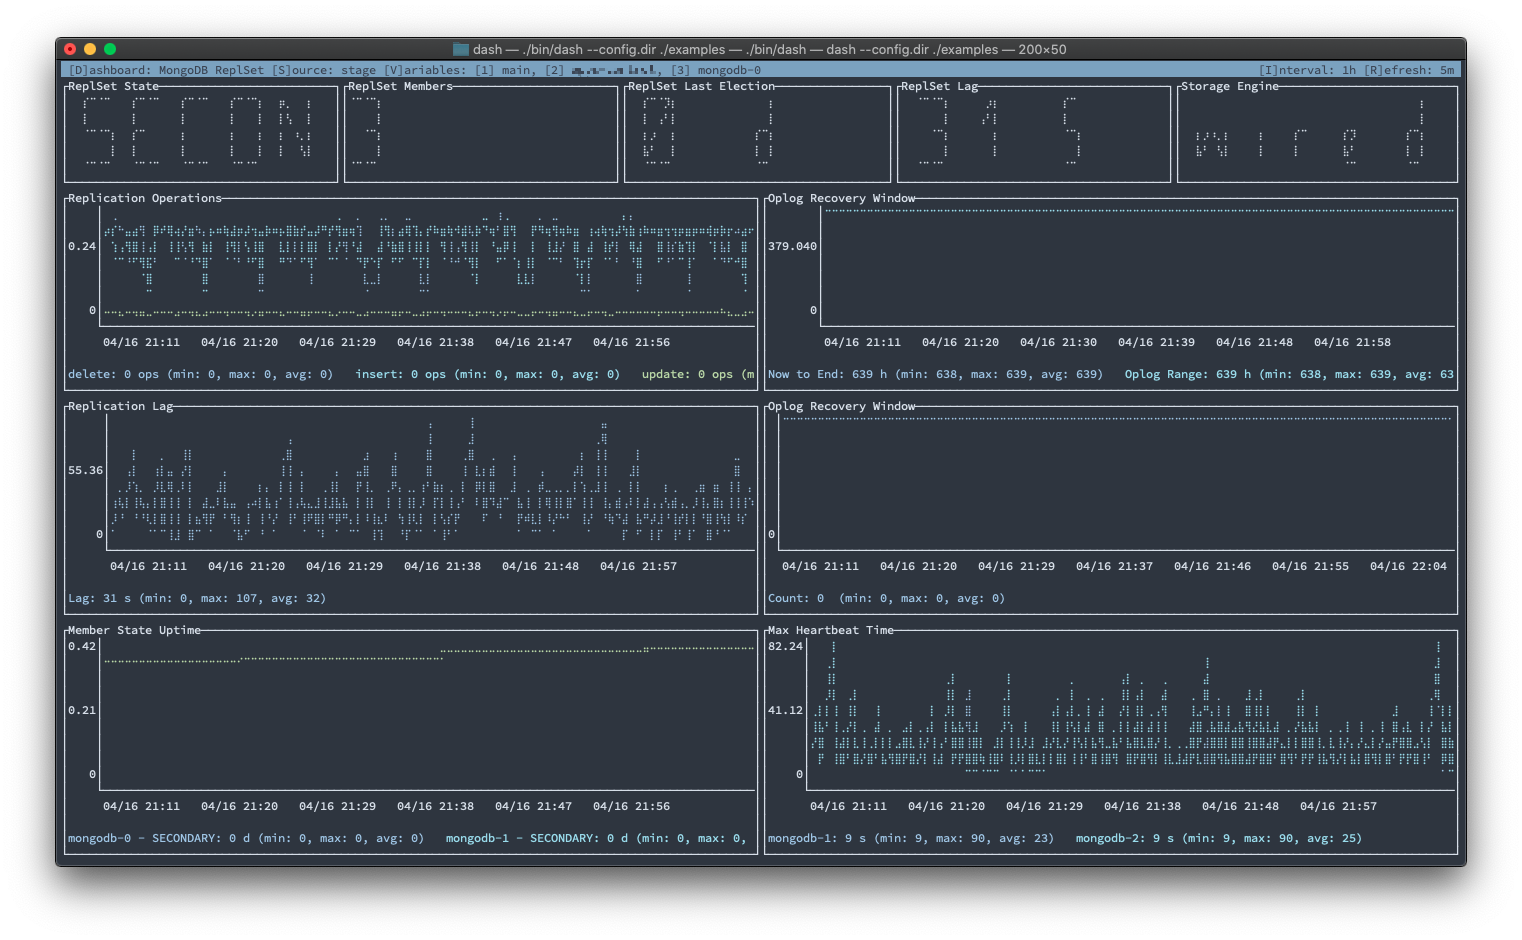
dash is a terminal dashboard solution inspired by Grafana, to visualize and explore your data.
- Multiple Datasources: Multiple datasources can be defined via yaml files.
- Multiple Dashboards: Dashboards can be defined via yaml files and can be switch during runtime.
- Time Interval: Query the data for different time intervals.
- Refresh Rate: Refresh your data every x seconds.
- Multiple Graphs: Choose between multiple graph types to visualize your data.
- Dynamic Datasources: Use multiple datasources for one dashboard.
- Explore Mode: Run ad hoc queries to explore your data.
Note: If you want to contribute (adding a missing or new feature) feel free to create a PR. If you want to share a dashboard please add the
.yamlfile and a screenshot to the examples folder.