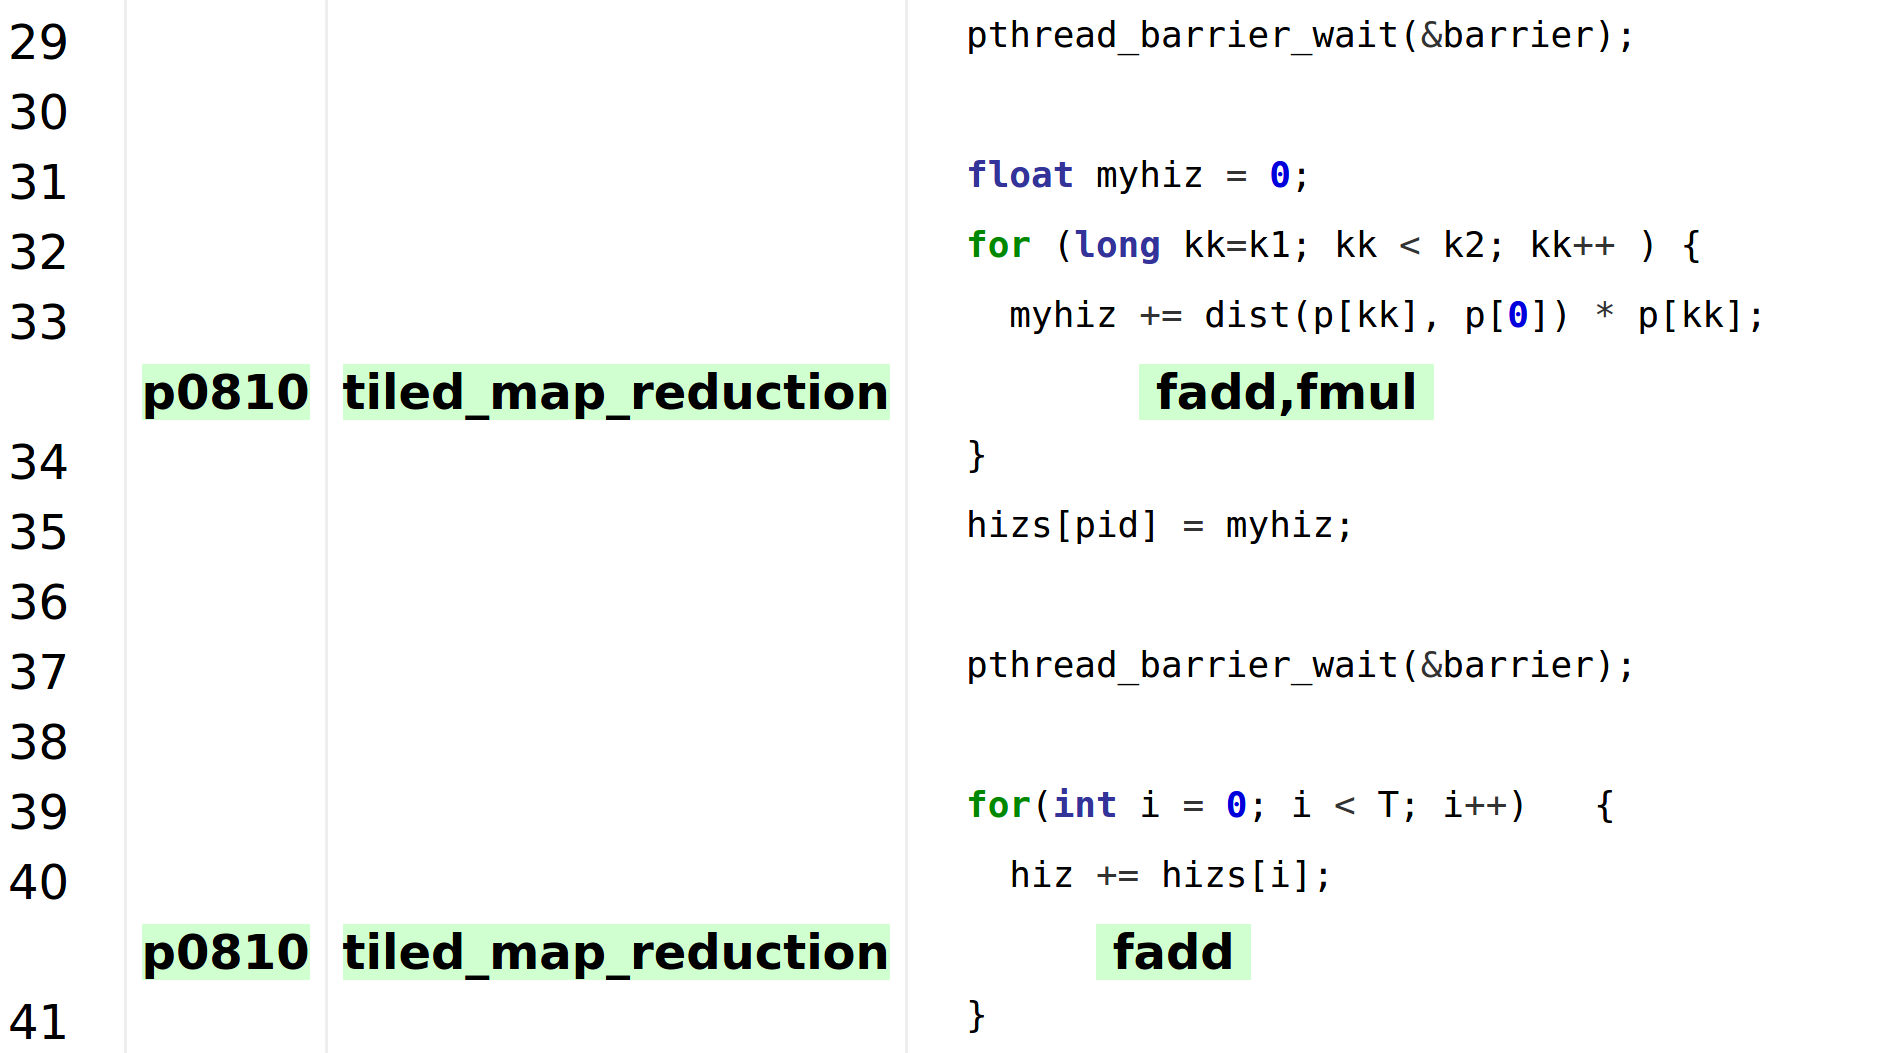
This repository contains a tool for finding parallel patterns in the execution of sequential and multi-threaded C and C++ code. The tool instruments the code and generates execution traces using an extended version of LLVM, and finds parallel patterns on the traces using a combination of high-level exploration and constraint-based graph matching techniques.
The code instrumentation and trace generation component is implemented on top of LLVM's DataFlowSanitizer. Most of the additions can be found in the files llvm/lib/Transforms/Instrumentation/DataFlowSanitizer.cpp and compiler-rt/lib/dfsan/dfsan.cc.
-
Clang 7 or later (to compile the project)
-
Boost 1.68 or later
On Ubuntu 20.04, just run:
sudo apt-get install clang libboost-dev cmake ninja-build
Take the following steps (beware that compiling LLVM consumes a significant amount of resources):
git clone --recursive https://github.com/robcasloz/llvm-discovery.git
cd llvm-discovery
mkdir build
cd build
cmake -DCMAKE_C_COMPILER=clang -DCMAKE_CXX_COMPILER=clang++ -DBUILD_SHARED_LIBS=1 -DLLVM_ENABLE_PROJECTS="clang;compiler-rt" -DLLVM_TARGETS_TO_BUILD="X86" -DCMAKE_CXX_STANDARD=14 -DCMAKE_BUILD_TYPE=Release -G "Ninja" ../llvm
ninja compiler-rt clang
The directory llvm/tools/discovery/examples contains a simple hello-world.c example source file. To instrument it, run the compiled clang with the following arguments:
clang -g -fno-discard-value-names -Xclang -disable-lifetime-markers -fsanitize=dataflow -mllvm -dfsan-discovery llvm/tools/discovery/examples/hello-world.c
The optional argument -mllvm -dfsan-discovery-commutativity-list=FILE can be used to provide a Sanitizer special case list that lists external functions (for example from the standard C library) that can be part of parallel patterns. An example file can be found in llvm/tools/discovery/commutative.txt.
Running the instrumented binary generated by clang using the above command generates as a side effect a trace file in the working directory. This file is used as input to the parallel pattern discovery phase. It is important to run the instrumented binary with as small input data as possible, since the traces grow very quickly as the instrumented program executes.
The directory llvm/tools/discovery/examples contains the trace hello-world.trace generated by running the instrumented example.
The parallel pattern discovery finding component is implemented as a collection of Python scripts and MiniZinc graph matching models. Both can be found in the llvm/tools/discovery directory.
-
Python 3.8 or later
-
MiniZinc 2.3.2 or later
On Ubuntu 20.04, just run:
sudo apt-get install python3 python3-networkx
mkdir -p $MINIZINC_INSTALL_DIR
wget -qO- https://github.com/MiniZinc/MiniZincIDE/releases/download/2.5.3/MiniZincIDE-2.5.3-bundle-linux-x86_64.tgz | tar -xvzf - --directory $MINIZINC_INSTALL_DIR
export PATH=$PATH:$MINIZINC_INSTALL_DIR/MiniZincIDE-2.5.3-bundle-linux-x86_64/bin
To find patterns heuristically in the example trace, run:
llvm/tools/discovery/find_patterns.py llvm/tools/discovery/examples/hello-world.trace
The script outputs a table in CSV format where each row corresponds to a found pattern (identifier, location, loop whenever applicable, and pattern type).
To find patterns exhaustively in the example trace, add the option --level=complete to the same command:
llvm/tools/discovery/find_patterns.py --level=complete llvm/tools/discovery/examples/hello-world.trace
Beware that finding patterns exhaustively is computationally very costly and does not currently scale beyond small examples.
To test the pattern finder on a set of small examples, set the environment variable CC to the compiled clang and run:
cd llvm/tools/discovery
./test.py
The file llvm/tools/discovery/Makefile provides further support for processing, transforming, and visualizing traces; invoking the constraint-based pattern finder, and visualizing and exporting the found patterns as LLVM remark diagnostics. See the file documentation for more information.
-
Modernizing Parallel Code with Pattern Analysis. [Supplement]
Roberto Castañeda Lozano, Murray Cole, Björn Franke.
26th ACM SIGPLAN Symposium on Principles and Practice of Parallel Programming, 2021, accepted for publication. -
Parallelizing Parallel Programs: A Dynamic Pattern Analysis for Modernization of Legacy Parallel Code.
Roberto Castañeda Lozano, Murray Cole, Björn Franke.
ACM International Conference on Parallel Architectures and Compilation Techniques, 2020.
If you have questions or suggestions, please do not hesitate to contact us:
